Figure 1.
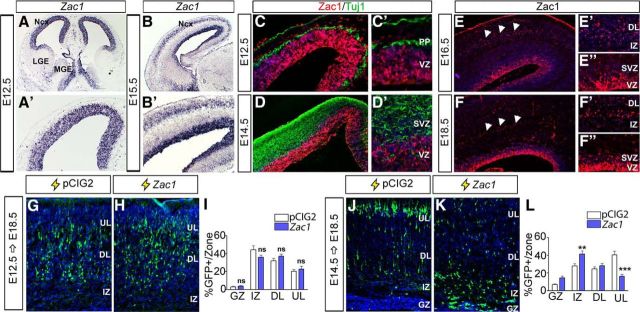
Zac1 overexpression perturbs cell migration during later stages of corticogenesis. A, B, Zac1 transcript distribution in E12.5 (A, A′) and E15.5 (B, B′) telencephalon. A′ and B′ are high-magnification images of A and B, respectively. C–F, Distribution of Zac1 (red, C–F″) and Tuj1 (green, C, D) protein in the E12.5 (C, C′), E14.5 (D, D′), E16.5 (E–E″), and E18.5 (F–F″) neocortex. C′–F′ are higher-magnification images of C–F, respectively. Arrowheads in E and F mark CP expression. Comparison of E12.5–E18.5 (G–I) and E14.5–E18.5 (J–L) electroporations of pCIG2 control (G, J) and pCIG2-Zac1 (H, K) analyzed for the distribution of GFP+ cells/zone (I, L).

