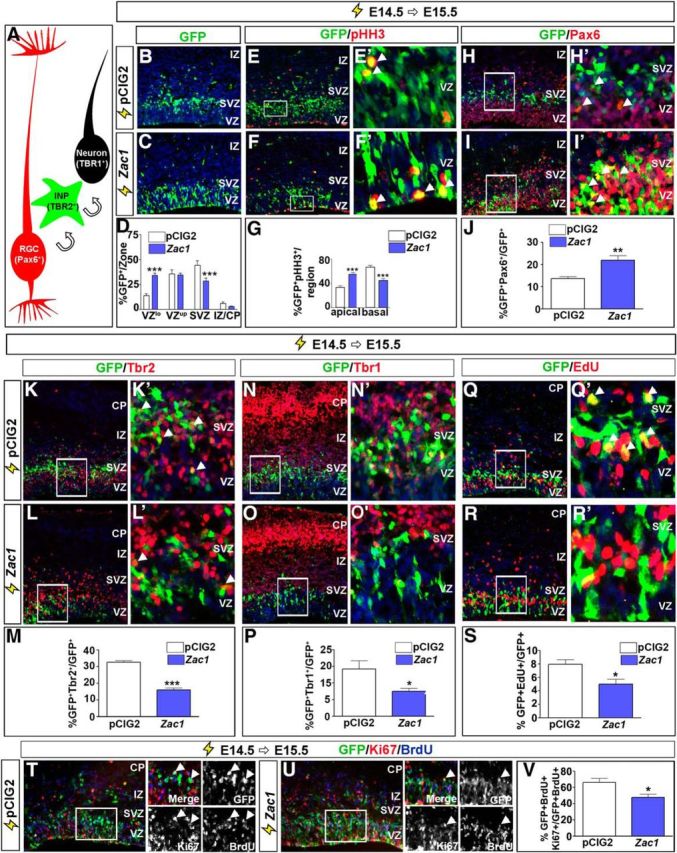
Figure 2.

Zac1 overexpression delays progenitor cell maturation and neuronal differentiation. A, Schematic illustration of cells transitioning from Pax6+ RGCs to Tbr2+ INPs to Tbr1+ differentiated neurons. B–S, E14.5–E15.5 electroporations of pCIG2 control (B, E, H, K, N, Q) and pCIG2–Zac1 (C, F, I, L, O, R) costained for GFP and pHH3 (E, E′, F, F′), GFP and Pax6 (H, H′, I, I′), GFP and Tbr2 (K, K′, L, L′), GFP and Tbr1 (N, N′, O, O′), and GFP and EdU (Q, Q′, R, R′). E′, F′, H′, I′, K′, L′, N′, O′, R′, and Q′ are high-magnification images of boxed regions in E, F, H, I, K, L, N, O, R, and Q, respectively. Arrowheads in E′, F′, H′, I′, K′, L′, and Q′ mark double-positive cells. Quantitation of GFP+ cells/zone (D), percentage pHH3+GFP+ mitotic cells in apical and basal regions of the cortex (G), percentage Pax6+GFP+/GFP+ cells (J), percentage Tbr2+GFP+/GFP+ cells (M), percentage Tbr1+GFP+/GFP+ cells (P), and percentage EdU+ GFP+/GFP+ cells (S) after the electroporation of pCIG2 (white bars, n = 3) and pCIG2–Zac1 (blue bars, n = 3). T–V, E14.5–E15.5 electroporations of pCIG2 control (T) and pCIG2-Zac1 (U) costained for GFP (green), Ki67 (blue), and BrdU (red) after a 24 h BrdU pulse. Quantitation of percentage Ki67+BrdU+GFP+/GFP+BrdU+ cells (V). Arrowheads in T and U point to BrdU+ proliferating cells that have been electroporated (GFP+) and have remained in the cell cycle (Ki67+). DAPI labeling is in blue for B–R′.
