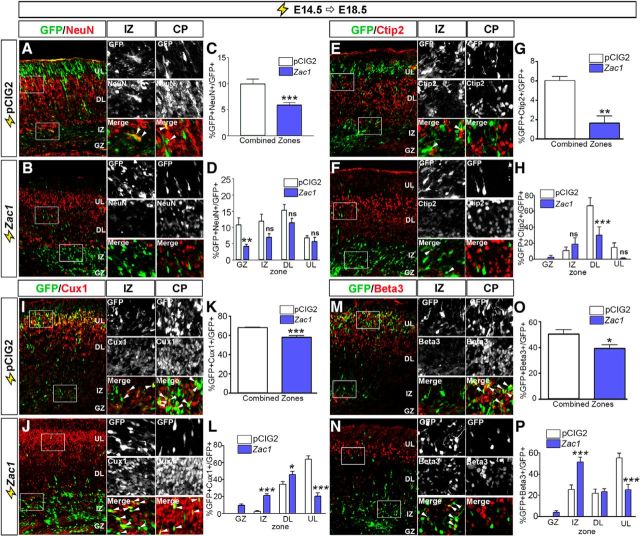
Figure 3.
Zac1 overexpression blocks neuronal differentiation. A–P, E14.5–E18.5 electroporations of pCIG2 control (A, E, I, M) and pCIG2–Zac1 (B, F, J, N) analyzed for the expression of GFP and NeuN (A, B), GFP and Ctip2 (E, F), GFP and Cux1 (I, J), and GFP and Beta3 (M, N). Insets to the right are high-magnification images of boxed regions in the IZ and CP in A, B, E, F, I, J, M, and N, and arrowheads mark double-positive cells. Quantitation of percentage NeuN+GFP+/GFP+ cells in total (C) and per zone (D), Ctip2+ GFP+/GFP+ cells in total (G) and per zone (H), Cux1+ GFP+/GFP+ cells in total (K) and per zone (L), and Beta3+ GFP+/GFP+ cells in total (O) and per zone (P) after the electroporation of pCIG2 (white bars, n = 3) and pCIG2–Zac1 (blue bars, n = 3).

