Figure 4.

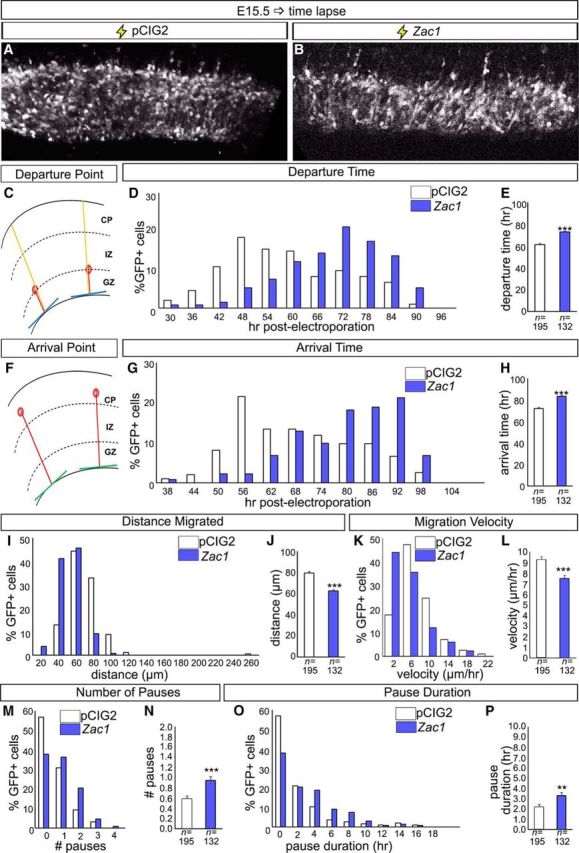
Altered migratory properties of Zac1 overexpressing cortical cells. A–P, Biphoton time-lapse microscopy of E15.5 cortical slice cultures electroporated with pCIG2 and pCIG2–Zac1. A, B, Photomicrographs of GFP+ cells imaged 30 h after electroporation of pCIG2 (A) and pCIG2–Zac1 (B). C–E, Measurement of departure time defined as hours after transfection when GFP+ cells left the GZ and entered the IZ (C). Departure times for 195 pCIG2 (white bars) and 133 pCIG2–Zac1 (blue bars) transfected cells were recorded individually (D) and averaged (E). F–H, Measurement of arrival time defined as hours after transfection when GFP+ entered the CP (F). Arrival times for 195 pCIG2 (white bars) and 133 pCIG2–Zac1 (blue bars) transfected cells were recorded individually (G) and averaged (H). I, J, Measurement of total distance (micrometers) migrated for 195 pCIG2 (white bars) and 133 pCIG2–Zac1 (blue bars) transfected cells recorded individually (I) and averaged (J). K, L, Measurement of migration velocity (micrometers per hours) migrated for 195 pCIG2 (white bars) and 133 pCIG2–Zac1 (blue bars) transfected cells recorded individually (K) and averaged (L). M, N, Quantitation of pauses in migration defined as any movement <3.5 μm over 2 consecutive hours of recording for 195 pCIG2 (white bars) and 133 pCIG2–Zac1 (blue bars) individual transfected cells (M) and averaged (N). O, P, Quantitation of pause duration in hours for 195 pCIG2 (white bars) and 133 pCIG2–Zac1 (blue bars) individual transfected cells (O) and averaged (P).
