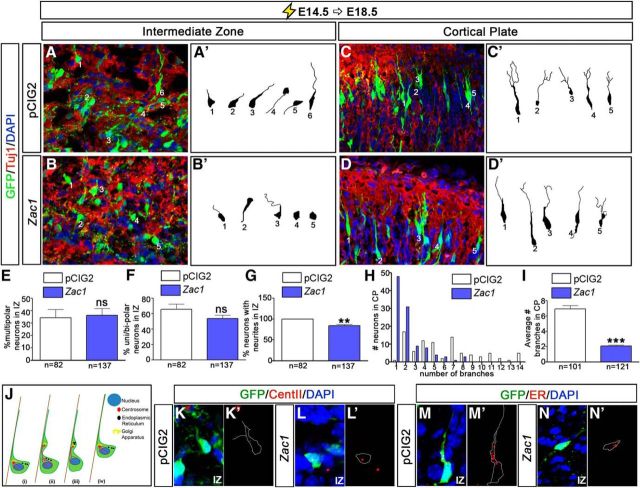
Figure 5.
Zac1 overexpression alters the morphology of migrating neurons. A–D, E14.5–E18.5 electroporations of pCIG2 (A, C; white bars) and pCIG2–Zac1 (B, D; blue bars). GFP+Tuj1+ neurons (A–D) were traced (A′–D′) in the IZ (A′, B′) and CP (C′, D′) from pCIG2 (n = 82 in IZ; n = 101 in CP) and pCIG2–Zac1 (n = 137 in IZ; n = 121 in CP) electroporations. E–I, Quantitation of percentage multipolar neurons in the IZ (E), percentage unipolar/bipolar neurons in the IZ (F), percentage neurons with neurites in the IZ (G), number of branches per neuron in the CP (H), and average number of branches in the CP (I). J, Schematic illustration of glial guided locomotion; saltatory movements begin with the centrosome, which is in front of the nucleus, and sends out microtubules to form a fork/cage around the nucleus (i). The leading process of the migrating neuron dilates and the centrosome enters (ii). Other organelles, such as the Golgi apparatus and ER, enter the dilated leading process (iii). Finally, microtubules attached to the centrosome pull the nucleus into the dilation (iv). K–N, E14.5–E18.5 coelectroporations of pCIG2 (K, K′, M, M′) or pCIG2–Zac1 (L, L′, N, N′) with RFP–CENT2 (K, K′, L, L′) or pEF/Myc/ER/mCherry (M, M′, N, N′). GFP+ cells were traced in K′–N′ to highlight the position of the organelles within the transfected cells. ns, Not significant.

