Figure 6.

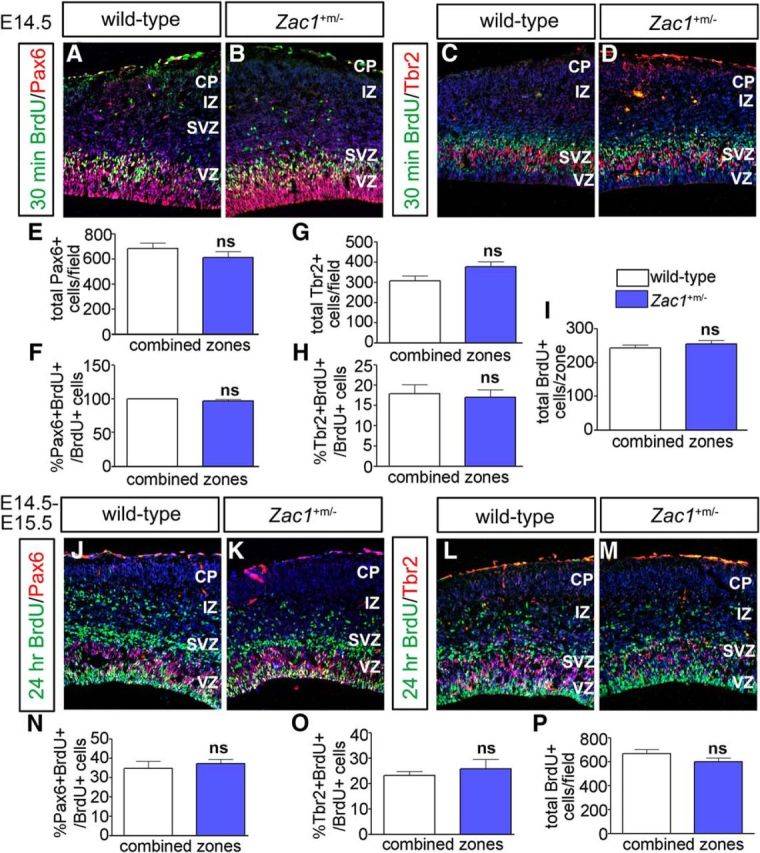
Loss of Zac1 does not alter progenitor cell dynamics. A–I, Analysis of Pax6/BrdU (A, B) and Tbr2/BrdU (C, D) coexpression in E14.5 wild-type and Zac1 mutant (B) cortices after a 30 min BrdU pulse. DAPI labeling is blue counterstain. Quantitation of total number of Pax6+ cells (E), percentage Pax6+BrdU+/BrdU+ cells (F), total number of Tbr2+ cells (G), percentage Tbr2+BrdU+/BrdU+ cells (H), and total BrdU+ cells (I) in wild-type (n = 3; white bars) and Zac1 mutants (n = 3; blue bars). J–P, Analysis of Pax6/BrdU (J, K) and Tbr2/Brdu (L, M) coexpression in E15.5 wild-type (L) and Zac1 mutant (M) cortices after a 24 h BrdU pulse. DAPI labeling is blue counterstain. Quantitation of the percentage Pax6+BrdU+/BrdU+ cells (N), percentage Tbr2+BrdU+/BrdU+ cells (O), and total BrdU+ cells (P) in wild types (n = 3; white bars) and Zac1 mutants (n = 3; blue bars).
