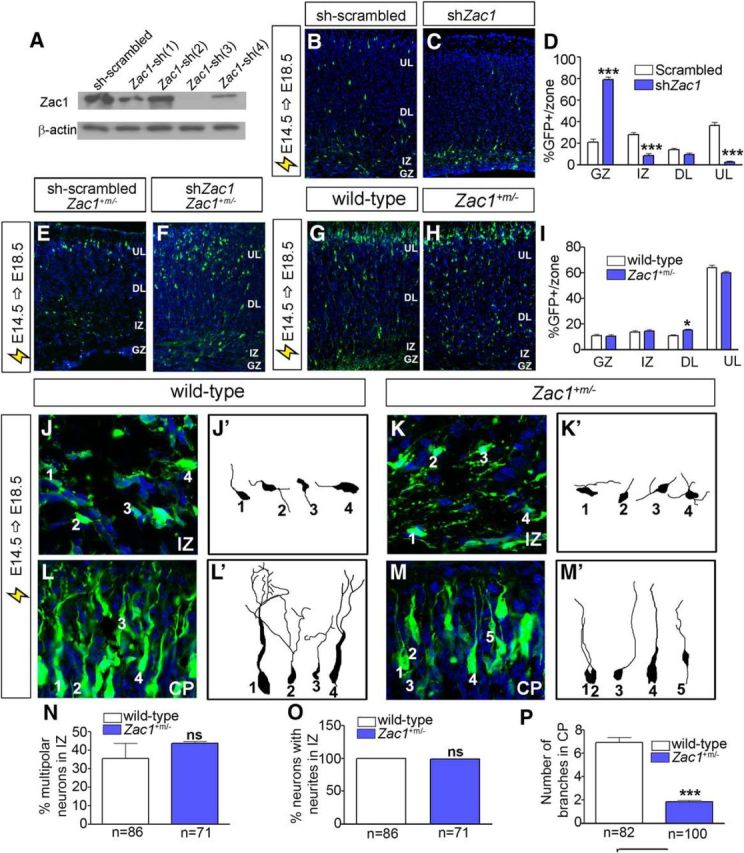
Figure 8.

Aberrant morphology of migrating neurons in Zac1 mutant cortices. A, Western blot analysis of Zac1 and β-actin protein levels in NIH-3T3 cells cotransfected with pCIG2–Zac1 along with different shRNA constructs. B–D, E14.5–E18.5 electroporations of sh-scrambled control (B) and shZac1 vectors (C) in wild-type CD1 timed pregnant females. Quantitation of percentage GFP+ cells/layer for sh-scrambled (n = 3; white bars) and shZac1 (n = 3; blue bars) (D). E, F, E14.5–E18.5 electroporations of Zac1 mutant cortices with sh-scrambled and sh-Zac1 constructs. G–I, E14.5–E18.5 electroporation of pCIG2 in wild-type (G) and Zac1 mutant (H) cortices. Quantitation of percentage GFP+ cells in each layer for wild-type (n = 3; white bars) and Zac1 mutant (n = 3; blue bars) cortices (I). J–P, E14.5–E18.5 electroporation of pCIG2 in wild-type (J, L) and Zac1 mutant (K, M) cortices, with images taken in the IZ (J, K) and CP (L, M). GFP+Tuj1+ neurons in wild-type IZ (J′) and CP (L′) and in Zac1+m/− IZ (K′) and CP (M′) were traced. Quantitation of percentage multipolar neurons in IZ of wild-type (n = 86; white bars) and Zac1 mutant (n = 71; blue bars) cortices (N). Quantitation of percentage neurons with neurites in the IZ of wild-type (n = 86; white bars) and Zac1 mutant (n = 71; blue bars) cortices (O). Quantitation of the number of branches in the CP of wild-type (n = 82; white bars) and Zac1 mutant (n = 100; blue bars) cortices (P). DL, Deep layer; UL, upper layer.
