Figure 9.
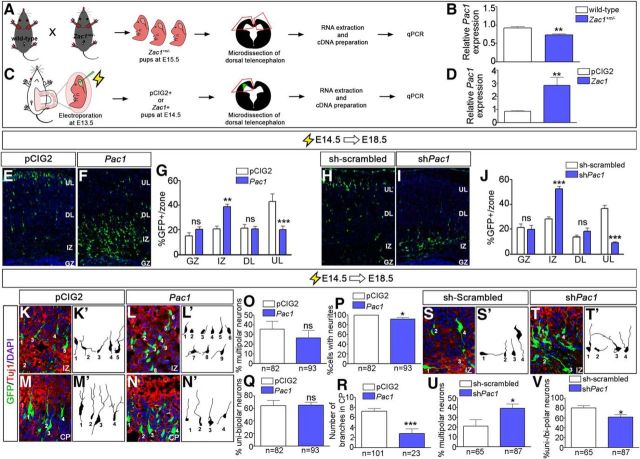
Zac1 regulates neuronal migration by regulating Pac1 transcription in the developing neocortex. A–D, Schematic of the experimental design to test whether Zac1 regulates the expression of Pac1 in E15.5 Zac1+m/− cortices (A) and in E13.5–E14.5 Zac1 gain-of-function assays (C). Quantitation of qPCR data, showing reduced Pac1 transcript levels in Zac1+m/− cortices [n = 4 for both wild-type (white bars) and Zac1 mutant (blue bars); B] and increased Pac1 transcript levels after Zac1 misexpression [n = 6 for both pCIG2 (white bars) and pCIG2–Zac1 (blue bars); D]. E–G, E14.5–E18.5 electroporations of pCIG2 (E) and pCIG2-Pac1 (F). Quantitation of percentage GFP+ cells in each layer for pCIG2 control (n = 3; white bar) and pCIG2–Pac1 (n = 3; blue bar) (G). H–J, E14.5–E18.5 electroporations of sh-scrambled (H) and shPac1 (I). Quantitation of percentage GFP+ cells in each layer for pCIG2 control (n = 3; white bar) and shPac1 (n = 3; blue bar) (J). K–R, E14.5–E18.5 electroporations of pCIG2 (K, M) and pCIG2–Pac1 (L, N), showing coimmunolabeling of GFP (green) and Tuj1 (red). Blue is DAPI counterstain. Tracing of GFP+Tuj1+ neurons in the IZ from pCIG2 control (n = 82; K′) and pCIG2–Pac1 (n = 93; L′) electroporations. Quantitation of percentage multipolar cells (O), percentage cells with neurites (P), and percentage unipolar or bipolar neurons (Q) for pCIG2 control (n = 3; white bars) and pCIG2–Pac1 (n = 3; blue bars). Tracing of GFP+Tuj1+ neurons in the CP from pCIG2 control (n = 101; M′) and pCIG2–Pac1 (n = 23; N′) electroporations. Quantitation of average number of branches per neuron in the CP (R). S–V, E14.5–E18.5 electroporations of sh-scrambled (S) and shPac1 (T), showing coimmunolabeling of GFP (green) and Tuj1 (red). Blue is DAPI counterstain. Tracing of GFP+Tuj1+ neurons in the IZ from pCIG2 control (n = 82; S′) and shPac1 (n = 87; T′). Quantitation of percentage multipolar neurons (U) and percentage unipolar or bipolar neurons (V) for sh-scrambled (n = 3; white bars) and shZac1 (n = 3; blue bars).

