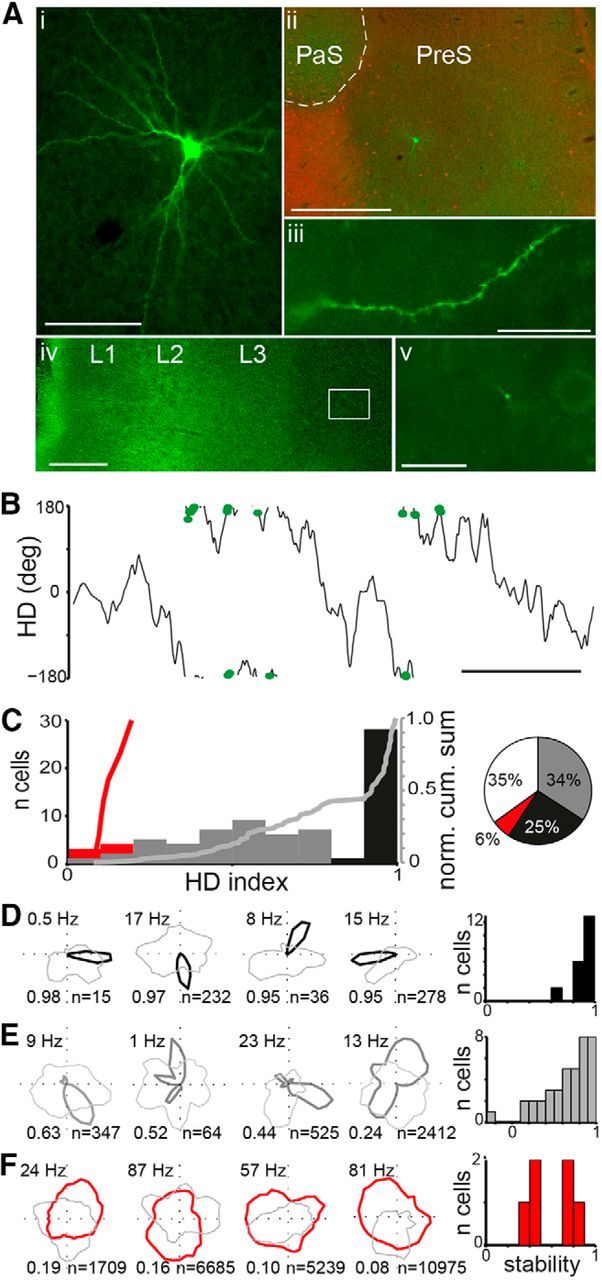
Figure 2.

HD-modulated firing patterns. A, Recovered HD RS cell (green) with pyramidal morphology (i), located in layer 3 of the presubiculum (ii; tangentially cut section; red, calbindin staining), extended spiny dendrites (iii) into layer 1 and an axon into MEC (iv), where boutons could be discerned (v). B, The cell fired APs (black dots) strongly modulated by HD (gray line). Scale bar, 5 s. C, Histogram of HD tuning for all recorded cells that displayed significantly HD-modulated firing (n = 81 cells). The HDI value of 0.8, where a plateau can be seen in the normalized cumulative sum (“norm. cum. sum”, light gray line for RS), was chosen as the point to distinguish strong (black) from moderate (gray) HD-modulated RS cells. FS cells (red) were weakly HD modulated. D–F, Firing rates from example RS cells representing strong (D; black lines; cell in A, B is on far right) and moderate HD cells (E, dark gray lines), and FS cells (F, red lines). Light gray lines indicate occupancy. Numbers indicate peak firing rate (top left), HDI (bottom left), and number of recorded APs (bottom right). Histograms on right indicate stability, defined as the correlation between the HD tuning curves from the first and second half of the recording, for all cells where the rat sampled all HD bins in each half of the recording. Scale bars: Ai, 100 μm, Aii, 500 μm, Aiii, Av, 20 μm, Aiv, 200 μm; B, 5 s.
