Figure 3.

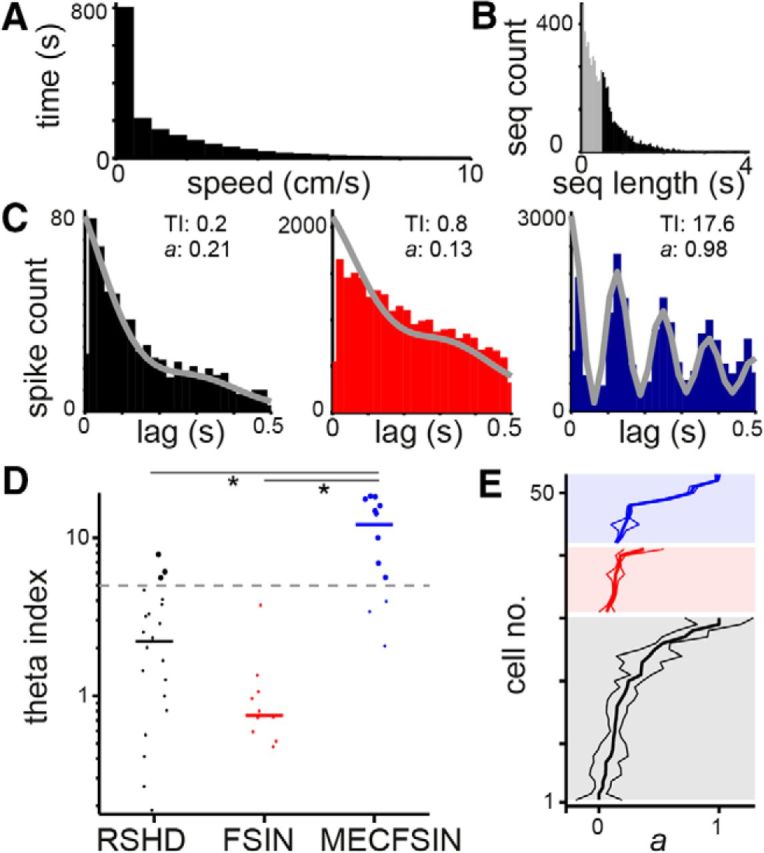
Cells in the presubiculum show weak theta rhythmicity. A, Distribution of speeds for all recordings. B, Distribution of movement sequences (seq); theta analysis was only performed on sequences (black) in which the rat moved continuously for >0.5 s. C, Spike autocorrellograms show little theta rhythmicity for a representative HD RS (left) and FS cell (middle), but strong theta rhythmicity for a FS cell in the MEC (right). TI indicates theta index; a quantifies rhythmicity based on a MLE parametric model fit (gray lines; see Materials and Methods). D, Theta-modulated cells (index >5, gray dashed line) are indicated as large dots. For each cell class, horizontal bars indicate medians. Cell classes were not from a single distribution (p < 1 * 10−5, Kruskal–Wallis test). *p < 0.01, post hoc Dunn-Sidak test, indicating a significant difference between MEC FS cells (MECFSIN) and presubicular HD-tuned RS cells (RSHD) and FS cells (FSIN). E, Distribution of a for all cells recorded during periods in which the rat moved sufficiently. For each class (color-coded as in C), cells were ordered by their a value; values are plotted as a thick line, with thin lines indicating 95% confidence intervals. Note narrow confidence intervals, indicating that the a values were reliable estimates of theta rhythmicity in these recordings.
