Figure 1.
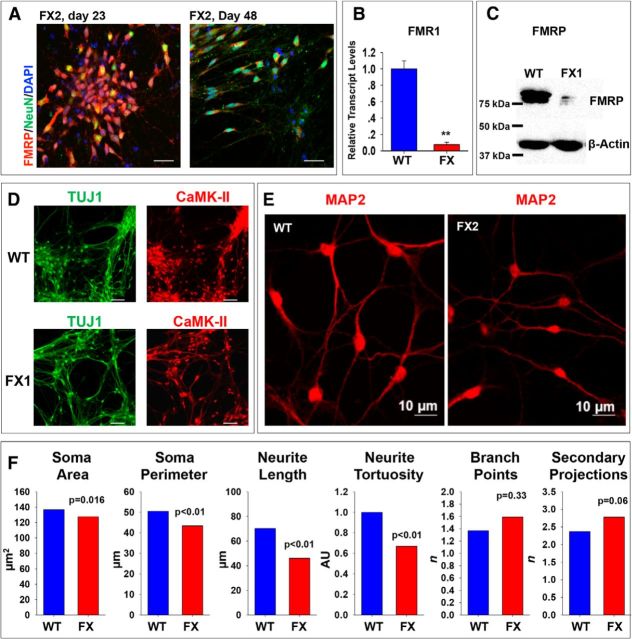
Differentiation and characterization of WT and FX neurons. A, Representative images of neurons derived from FX-hESCs at day 23 (left) and 48 (right) after IVND in the FX2 line (repeated for all lines), stained for FMRP (red), NeuN (green), and DAPI (blue). Scale bars, 50 μm. B, qRT-PCR analysis of FMR1 transcription in neurons at day 60 of IVND; WT (blue), FX (red, average of all three FX lines). Values are mean ± SEM. **p < 0.01, t test. C, Western blot analysis of FMRP translation at day 60 of IVND, as described in B shown for WT and FX1 line (performed 2–3 times in all lines). D, Representative images of neurons at day 60 of IVND shown for WT (top) and FX1 (bottom, repeated for all three FX lines) stained for TUJ1 (green) and CaMK-II (red). Scale bars, 50 μm. E, Representative images of WT (left) and FX2 (right) neurons at day 60 of IVND stained for MAP2 (red), repeated also in line FX3. F, Quantification of neuronal morphology in MAP2-stained neurons as shown in E, including: soma area and perimeter, neurite length, neurite tortuosity (AU, arbitrary units), and the number of branch points and secondary projections. E, F, Number of cells included in the analysis: WT, n = 43; FX2, n = 17; FX3, n = 22. WT is shown in blue and the average value for FX2 and FX3 is shown in red. Values are mean ± SEM. *p < 0.05; **p < 0.01, t test.

