Figure 1.
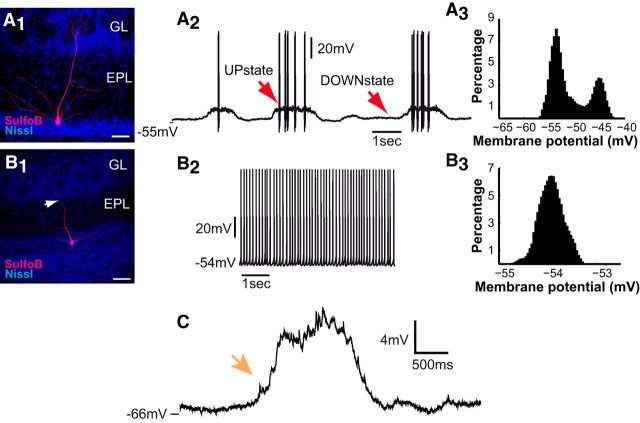
UP and DOWN states in mitral cells are generated in the glomerular layer. A1, Mitral cell loaded with SrB (red) during whole-cell recording in olfactory bulb acute slices, with Nissl stain (blue) as a counterstaining. A2, Whole cell patch-clamp recording of an MC in the current-clamp configuration. The membrane potential shows spontaneous alternations between depolarized states associated with spikes (UP states) and hyperpolarized silent periods (DOWN states). A3, Such activity results in a bimodal distribution. B1, Mitral cell with a truncated dendritic apical tuft (arrow). B2, B3, Patch-clamp recording shows an unimodal distribution of the membrane potential, and 95% of these truncated MCs display a tonic firing pattern such as the example illustrated in B2 (n = 17). Note that none of the MCs with an intact apical dendrite exhibited such a tonic spiking (n = 61). C, Example UP state recorded with hyperpolarizing current injection. The membrane potential shows a short buildup of EPSPs before transitioning to the UP state (orange arrow). Scale bars: 50 μm.

