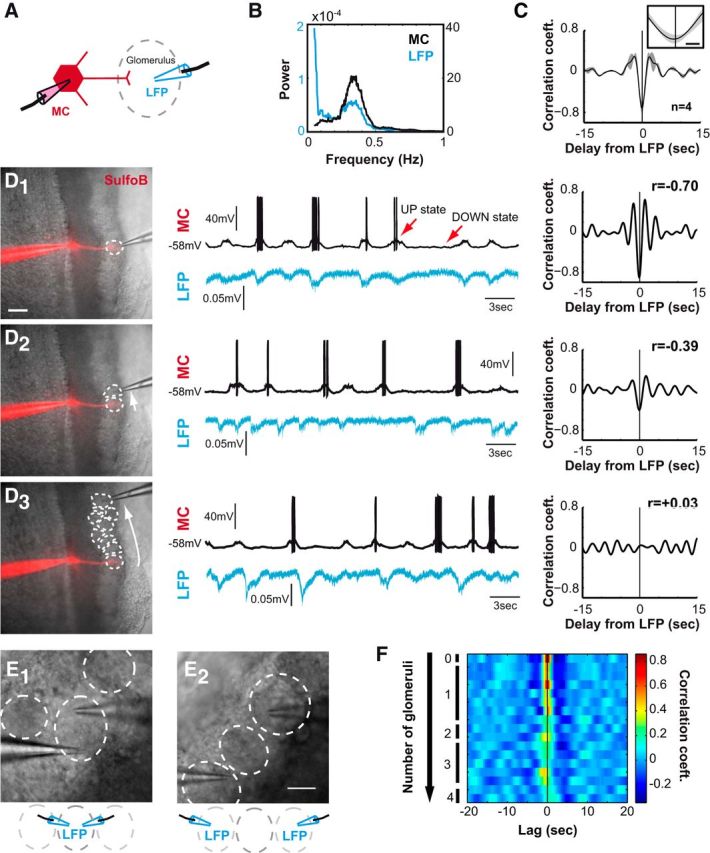
Figure 3.

Mitral cell slow oscillations are correlated with glomerular network activity in olfactory bulb acute slices. A, Schematic drawing of the recording configuration (the whole-cell pipette used to record MC membrane potential contained SrB; red). Diffusion of the dye within the MC allowed localizing the glomerulus where its primary dendrite projected. The glomerular LFP was recorded with an extracellular pipette (blue) located in this glomerulus. B, Power spectrum of two typical signals illustrated in D1: both MC membrane potential (black) and LFP signals (blue) present a prominent component in the slow (0.05–0.5 Hz) frequency range. C, Averaged cross-correlogram between MC and LFP signals (LFP being the reference) shows a strong correlation between these two signals (r = −0.69 ± 0.09, n = 4). Note that the MC precedes the LFP with a delay of ∾80 ms. The gray area indicates the SEM, and the inset highlights the 2 s surrounding the zero lag value (scale bar: 500 ms). D1–D3, Left, DIC images corresponding to the recordings shown in the center. Glomeruli are delimited by dotted lines, and the MC is loaded with SrB (red). Scale bar, 100 μm. Center, mitral cell membrane potential and LFP in the glomerular layer recorded simultaneously. Deflections visible in the glomerular LFP indicate coherent network activity. Right, Cross-correlograms corresponding to the signals depicted in the central panels. D1, Typical recordings of an MC and the LFP (blue) monitored in the glomerulus where the MC sends its primary dendrite (see diagram in A). D2, Recording of the same MC as in D1 with the LFP monitored in the adjacent glomerulus. D3, Recording of the same MC as in D1 and D2 with the LFP monitored in a distant glomerulus. The absolute value of the correlation between the two signals is higher (r = −0.70) for the LFP monitored in the glomerulus where the MC projects its principal dendrite (D1) than for the LFP recorded in adjacent (r = −0.39; D2) or distant (r = 0.03; D3) glomeruli. E1, E2, LFPs in the glomerular layer were recorded simultaneously within the same glomerulus (E1) and or two different glomeruli (E2). F, Cross-correlations between pairs of LFP signals recorded in the glomerular layer. Each row corresponds to the recording of one pair of glomeruli. The number of glomeruli between recording sites is indicated on the left, with 0 corresponding to recordings in the same glomerulus (like in E1). Values computed for cross-correlation (calculated for ∼500 s of the filtered signals) are color coded. Note that cross-correlation is higher for LFPs monitored in the same glomerulus than for LFP recorded in different glomeruli.
