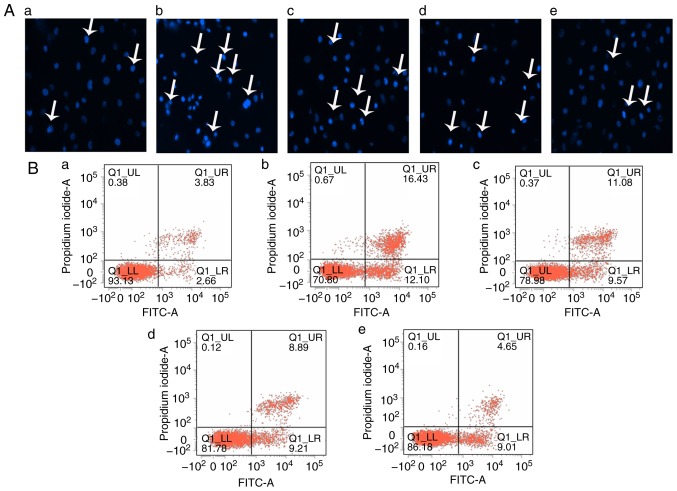
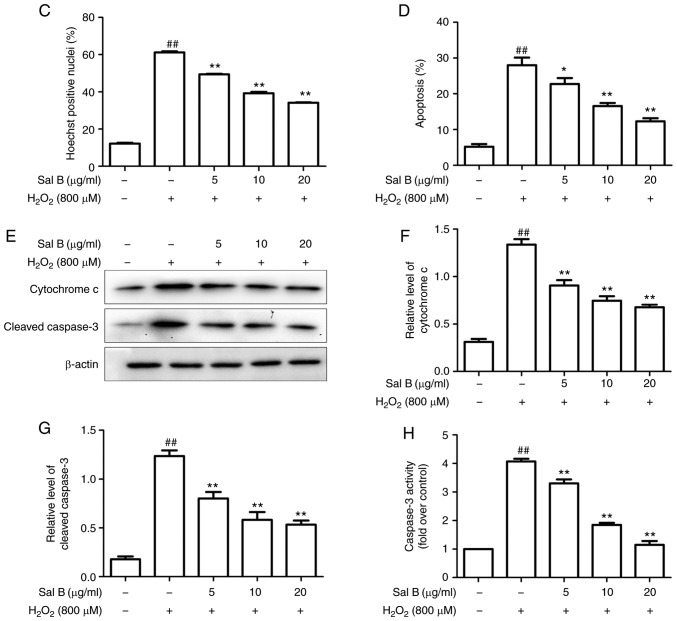
Figure 3.
Sal B inhibits H2O2-induced apoptosis in HUVECs. (A) HUVECs were treated with H2O2 in the presence or absence Sal B, and the cells were stained with Hoechst 33258 (white arrows indicate apoptotic cells; magnification, ×200). (B) Flow cytometric analysis of HUVEC apoptosis was stained by Annexin Ⅴ-FITC/propidium iodide double staining; (a) control group; (b) H2O2 group; (c) H2O2 + 5 µg/ml Sal B group; (d), H2O2 + 10 µg/ml Sal B group; (e) H2O2 + 20 µg/ml Sal B group. (C) Rate of apoptosis quantified by Hoechst. (D) Rate of apoptosis quantified by flow cytometry; Sal B decreased apoptosis of the HUVECs induced by H2O2. Data are representative of three independent experiments (mean ± SEM); ##P<0.01 compared with the control group; *P<0.05 and **P<0.01 compared with the H2O2 group. (E) Sal B decreased H2O2 -induced caspase-3 activity. ##P<0.01 compared with the control group; **P<0.01 compared with the H2O2 group. (F) HUVECs were incubated with different concentrations (5, 10, 20 µg/ml) of Sal B for 24 h and then stimulated with H2O2 (800 µM) for 24 h. The protein levels of cytochrome c and cleaved caspase-3 or β-actin were determined by western blotting. Bar charts show the quantification of (G) cytochrome c and (H) cleaved caspase-3. Relative protein levels are presented as the mean ± SEM of the optical density from three separate experiments. ##P<0.01 compared with control group; **P<0.01 compared with H2O2 group. HUVECs, human umbilical vein endothelial cells; Sal B, salvianolic acid B; H2O2, hydrogen peroxide.


