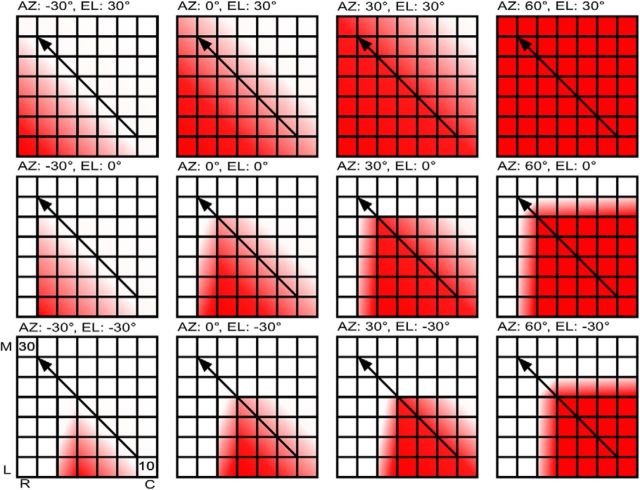
Figure 10.
Schematic representation of how activity distribution in the NSR changes based on overlapping ILD and frequency maps, and the 2D location of a source generating broadband noise. Each panel shows the same cortical region but with activity patterns for specific 2D locations in space (indicated above each panel). Sound source moves from IL to CL space in the left-column-to-right-column direction and from low to high elevations in the bottom-row-to-top-row direction. Cortical orientation is provided in the bottom left panel. M, Medial; L, lateral; R, rostral; C, caudal. The color saturation scales with activity levels. The diagonal arrow indicates that the tonotopic direction in the NSR is in the caudolateral-to-rostromedial direction. See text for additional details.

