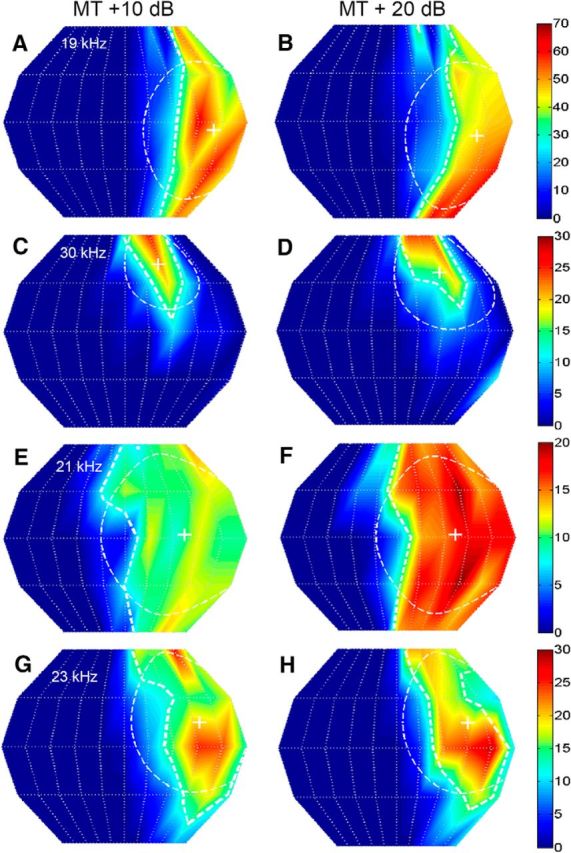
Figure 2.

The SRF properties of NSR neurons were stable with sound level. Each panel shows the 2D SRF of a NSR neuron. Left column, Responses were calculated for noise presented at MT + 10 dB. Right column, Responses from the same neuron shown to the left, but measured at MT + 20 dB. The response magnitude color chart is shown to the right of each neuron and corresponds to both the MT + 10 dB and MT + 20 dB plots. A, B, Neuron #41B05, CF = 19 kHz; the centroid azimuth at MT + 10 dB and MT + 20 dB was 54° and 53°, respectively. The centroid elevation at the two sound levels was −5° and −9°. The gyradii at the two different sound levels were 44° and 46°. C, D, Neuron #70C02; CF = 30 kHz; centroid azimuth = 28°; 35°; centroid elevation = 42°, 37°; gyradius = 28°, 36°. E, F, Neuron #83A01; CF = 21 kHz; centroid azimuth = 36°, 36°; centroid elevation = 3°, 2°; gyradius = 51°, 50°. G, H, Neuron #78B03; CF = 23 kHz; centroid azimuth = 47°, 48°; centroid elevation = 15°, 15°; gyradius = 43°, 43°.
