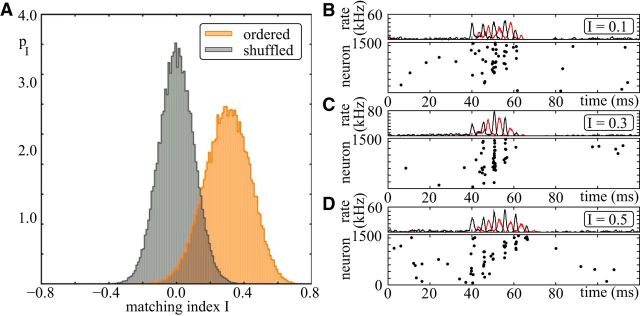
Figure 10.
Replay events elicited by unspecific (random) stimulation. After an initial exploration phase (15 runs, Δw = 50 cm, remaining parameters as before), a random subset of g0 = 50 excitatory neurons (Nex = 2500) is stimulated to spike synchronously. We consider all events with at least five ripples, i.e., five consecutive synchronous groups (3273 of 10,000 events). For each of these events, we draw S = 200 neurons out of the Npf = 1500 place-encoding neurons and calculate the matching index I for the spiking activity of these neurons only (to gain better statistics, we repeated the drawing 100 times for each event and evaluated the computed I independently). A, The resulting distribution of matching indices (orange) is shifted to positive values compared with the control setting where the neuron indices are shuffled before calculation of the matching indices (black): the spikes of the neurons within the events are ordered according to the order of their place-field centers along the linear track. B–D, Examples of spiking dynamics of subsets of S = 200 neurons (main panels) and the population activity (top; black, excitatory neurons; red, inhibitory neurons) for different matching indices I as indicated in the top panels.

