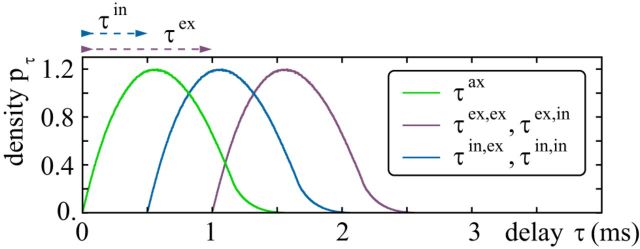
Figure 2.
Delay distributions for standard parameters. The green line shows the distribution of the (distance-dependent) axonal delay. The distribution of total conduction delays from excitatory-to-inhibitory and from inhibitory-to-inhibitory neurons is shown in blue (τin,ex = τin,in = τax + τin). Likewise the distribution of the total conduction delays to excitatory neurons is shown in purple (τex,ex = τex,in = τax + τex).

