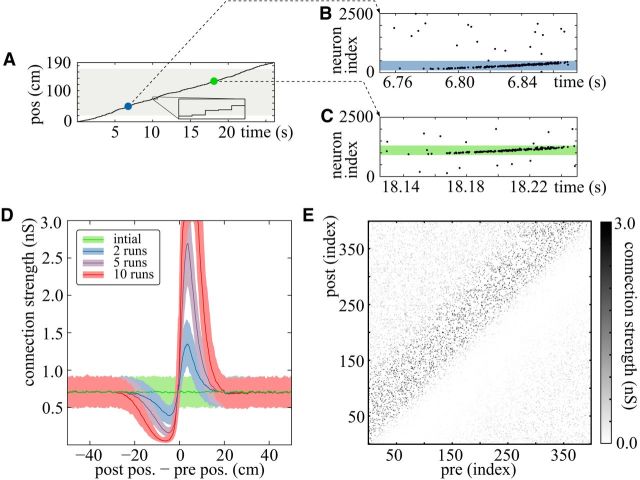
Figure 4.
Learning feedforward structures. A, Example trajectory of a modeled run along a linear track of a total length of Ltot = 190 cm with average velocity v̄ = 8 cm/s. For simplicity, we assume that the position is fixed for the short period of one theta cycle (T = 125 ms). Between consecutive theta cycles, the position increases randomly in a jump-like manner, here on average by 1 cm (compare zoomed view of the trajectory presented in the inset). Place fields are assigned to Npf = 1500 of Nex = 2500 excitatory neurons, and the centers are distributed homogeneously in the interval (indicated by the gray shaded area). B, C, Spiking activity of the excitatory neuron population for the period of one theta cycle at different positions (indicated by the blue and green markers in A). The colored area indicates the fraction of neurons with place fields containing the current position. D, Distribution of synaptic weights as a function of the distance between the place field centers of the postsynaptic and the presynaptic neuron. The solid line indicates the mean weight, and the colored area is the interval containing 80% of the weights (0.1- 0.9 percentile). Different colors show the distribution after different numbers of runs as indicated by the inset. E, Connectivity matrix for connections between the first 400 neurons after 10 runs (D, red curve).

