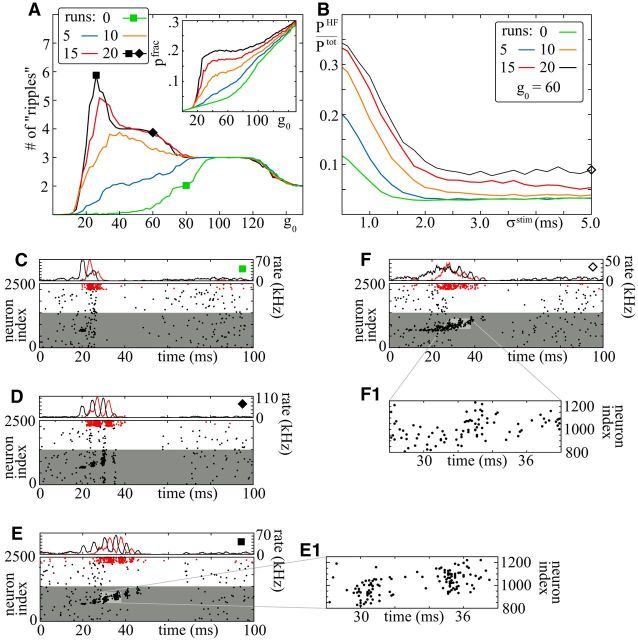
Figure 7.
Replay of spike patterns during sharp-wave/ripple-like events induced by synchronous stimulation. A, Average number of consecutive synchronous groups (ripples) versus the number of initially synchronously stimulated neurons g0 (spike times drawn from a Gaussian distribution with σstim = 0.5 ms). Different colors correspond to the different number of runs along the linear track. The inset shows the average fraction pfrac of place cells that spike at least once during the replay events. The data are derived by averaging over n = 10,000 replay events. B, The relative power in the high-frequency band (150–250 Hz) versus the temporal width σstim of the initial synchronous pulse. With increasing σstim, the relative power decreases. For large σstim, a signal can still propagate along the feedforward structure, yet the replay is not clearly structured in consecutive firing synchronous groups (therefore, no ripples occur; compare F). C–F, Examples of network activity (C–E, σstim = 0.5 ms; F, σstim = 5.0 ms): top, firing rate; bottom, spiking activity of the excitatory (black) and the inhibitory (red) neuron population. The size of the initial stimulation and number of runs along the linear track are indicted by the markers (top and A, B). The gray shaded area in bottom panels indicate the subset of neurons that have an active place field on the track. E1, F1, Close-up view of the spike data shown in E and F. For further explanations, see the main text.

