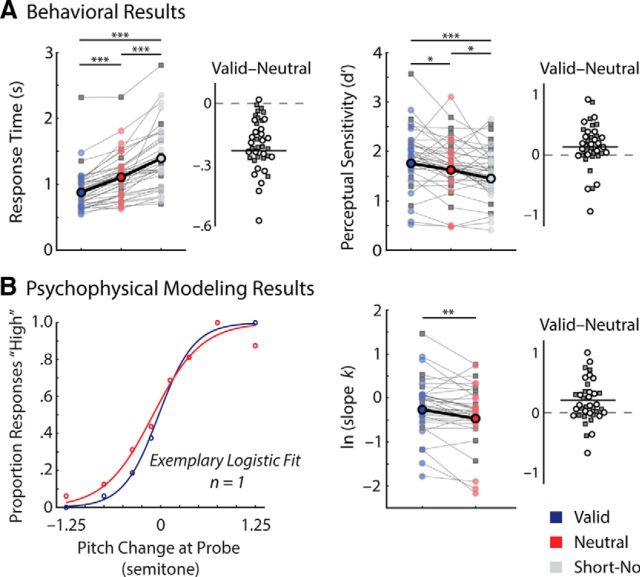
Figure 2.
Task performance and modeling parameter estimates as a function of retrocue condition. A, Behavioral performance of each retrocue condition including the short no-cue control condition is shown in RTs (left) and perceptual sensitivity (d′; right). Data points connected by thin lines indicate individuals' performances across retrocue conditions. Gray squares and circles respectively indicate performances in the behavioral-only experiment participants (n = 19) and the EEG participants (n = 20). Larger dots connected with a bold line indicate mean performances of the EEG participants. Density plots illustrate the individuals' differences (valid vs neutral) in the respective measures. The behavioral-only and EEG participants are respectively indicated with gray squares and circles. The solid line indicates the mean difference (valid vs neutral) of the EEG participants. B, Parameter estimates of psychophysical modeling results. Left, An example of a single participant's logistic model fits is illustrated for the valid and neutral retrocue conditions. Each open dot represents the proportion of “high” responses as a function of pitch change relative to the reference syllable presented during the encoding phase. The lines represent model fits. Right, Individuals' and group average perceptual precision estimates (log-transformed slope, k) of retrocue conditions and individuals' differences (valid vs neutral) of the precision estimates are shown with the same illustration scheme in A. *p < 0.05; **p < 0.005; ***p < 0.0005.

