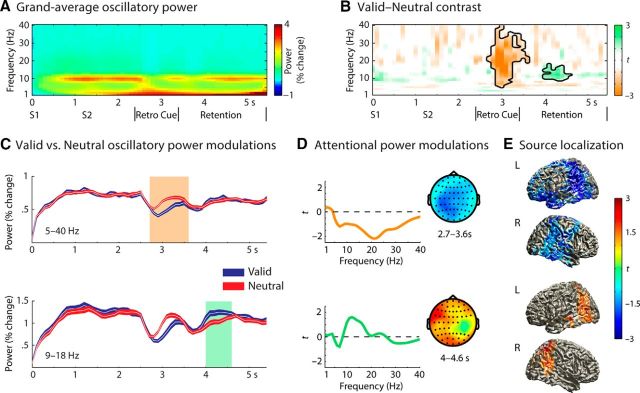
Figure 4.
Time–frequency representations of valid and neutral retrocue trials during the syllable pitch discrimination task. A, Grand average oscillatory power averaged across all EEG participants (n = 20) and across all (61) scalp electrodes. B, Illustrations of significant time–frequency clusters exhibiting valid versus neutral retrocue contrast. C, Relative oscillatory power change of a significant cluster exhibiting a neutral > valid retrocue effect (top) and of a cluster exhibiting a valid > neutral effect (bottom). Oscillatory power of the frequency range and electrodes from the corresponding cluster are averaged for each time point. Highlighted regions (orange and green) indicate the time windows of the significant clusters exhibiting retrocue condition differences from the statistical analysis. Shaded error lines indicate ±1 within-subjects SE. D, The distributions of t statistics over frequencies and scalp topographical maps of the significant neutral > valid (top) and valid > neutral clusters (bottom). Highlighted electrodes of scalp topographies belong to the corresponding clusters. Colors in the topographical maps correspond to the color bar in E. E, Source projections of oscillatory power contrast (valid vs neutral; 13 ± 4 Hz) on a standard MNI template brain. Source-projected t statistic maps of neutral > valid (top) and valid > neutral (bottom) effects are illustrated. For illustration purpose, a threshold of | t(19) | ≥ 1.5 is applied. L and R indicate left and right hemisphere, respectively. The color bar indicates t values of valid–neutral contrast.

