
Figure 1.
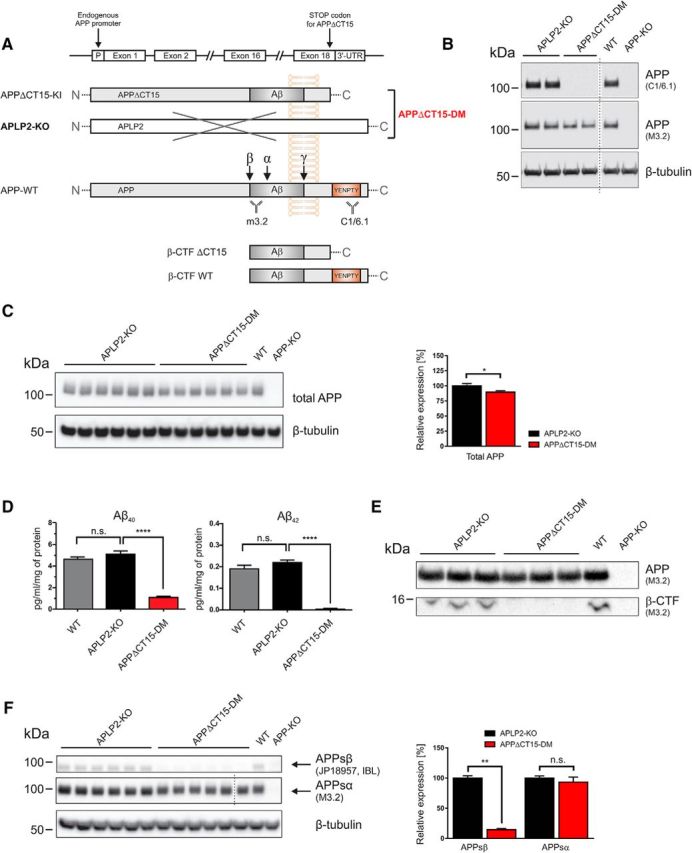
Analysis of APP processing in APPΔCT15-DM mice. A, Scheme depicting APP, WT, and APPΔCT15 truncation. A stop codon was inserted into APP exon18 leading to the deletion of the last 15 amino acids, including the YENPTY interaction motif. The APPΔCT15 variant is expressed under the control of the endogenous APP promoter. APPΔCT15-DM mice were generated by crossing APPΔCT15 knockin (KI) mice with APLP2-KO mice; for final heterozygous intercrosses, APPΔ/+APLP2-KO mice were used. APLP2-KO mice served as internal littermate controls. B, Expression of APP and antibody specificity was analyzed in brain homogenates from APLP2-KO littermate controls, APPΔCT15-DM, WT, and APP-KO mice. No signal is detected using C1/6.1 antibody directed against the APP C-terminus (top; for antibody epitopes, see A). M3.2 antibody detects both APP-WT and APPΔCT15, whereas no signal is obtained in APP-KO brain. β-tubulin staining served as a loading control. C, Western blot of total APP (M3.2 antibody) in adult mouse brain homogenates (left). Quantification (right) showed slightly reduced total APP levels in APPΔCT15-DM mice (∼89.6% of APLP2-KO set as 100%). D, Aβ40 and Aβ42 were quantified by ELISA. Aβ40 and Aβ42 levels were similar in APLP2-KO and WT mice. In contrast, Aβ40 and Aβ42 were severely reduced in APPΔCT15-DM mice. Aβ40: ANOVA, F(2,14) = 99,37; p < 0.0001 with Tukey's post hoc test; Aβ42: ANOVA, F(2,14) = 119.3; p < 0.0001 with Tukey's post hoc test; WT, n = 5; APLP2-KO, n = 6; APPΔCT15-DM, n = 6. E, β-CTF is detected in membrane fractions obtained from cortices of adult APLP2-KO littermate and WT mice using antibody M3.2 directed against the N-terminus of the Aβ-region. No β-CTFs were detectable in APPΔCT15-DM mice or APP-KO mice that served as a negative control. Short exposure of the same gel is shown for detection of full-length APP (top), long exposure (bottom) for β-CTF detection. F, Analysis of soluble APP fragments indicated highly reduced APPsβ (14.4% of APLP2 control mice) but only nonsignificant, minor reduction of APPsα (93.2%). Dotted line indicates that samples were run on the same gel but not in adjacent lanes. C, F, APLP2-KO, n = 6; APPΔCT15-DM, n = 6. Values are mean ± SEM. ****p < 0.0001 (t test). **p < 0.01 (t test). *p < 0.05 (t test). n.s., Not significant.