Figure 1.
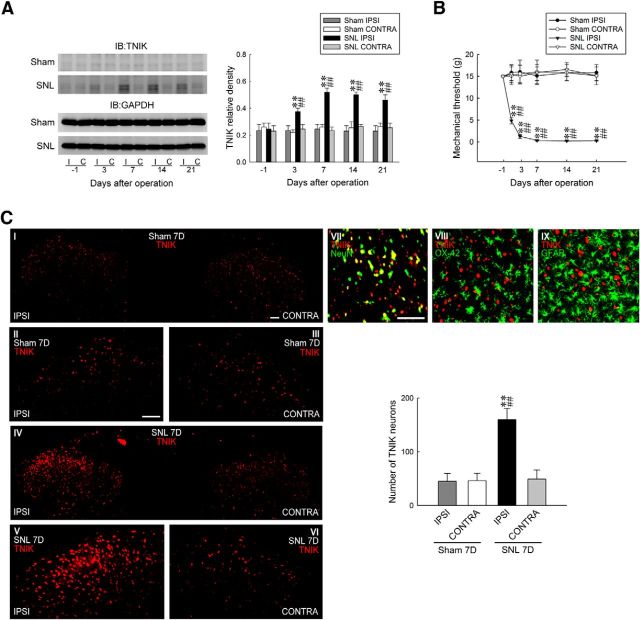
SNL upregulates TNIK expression in dorsal horn neurons. A, Representative WB and statistical analyses (normalized to GAPDH) revealing SNL-increased TNIK expression in the ipsilateral (I and IPSI), but not contralateral (C and CONTRA), dorsal horn. Two-way ANOVA with repeated measures over time: treatment, F(3,20) = 45.8, p = 0.002; time, F(4,80) = 4.672, p < 0.001; and treatment × time, F(12,80) = 5.322, p < 0.001. **p < 0.01 versus Sham IPSI; ##p < 0.01 versus SNL day 1. n = 6. IB, Immunoblotting. B, Time course of SNL-reduced withdrawal threshold of the hindpaw (von Frey test). Two-way ANOVA with repeated measures over time: treatment, F(3,24) = 56.39, p < 0.001; time, F(5,120) = 2.912, p = 0.016; and treatment × time, F(15,120) = 4.282, p < 0.001. **p < 0.01 versus Sham IPSI; ##p < 0.01 versus day 1. n = 7. C, Images and statistical analysis at day 7 after surgery revealing SNL-increased TNIK immunofluorescence (red) in the ipsilateral dorsal horn (SNL 7D), which is colocalized with neuronal (NeuN, green), but not microglial (OX-42, green) or astrocytic (GFAP, green), markers. One-way ANOVA, post hoc Tukey's test: F(3,24) = 24.68, p < 0.001. **p < 0.01 versus Sham IPSI; ##p < 0.01 versus SNL CONTRA. n = 7. Scale bar, 50 μm.

