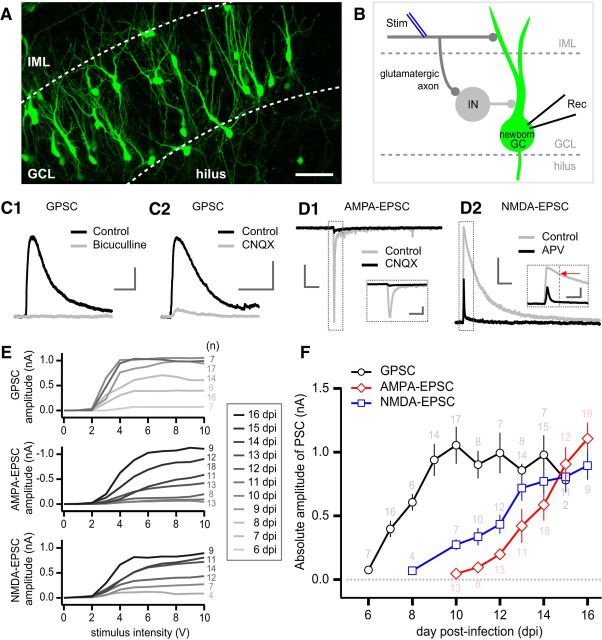
Figure 2.
Developmental changes of GPSCs and EPSCs in newborn GCs. A, Dentate gyrus of a hippocampal organotypic slice culture at 10 dpi. Newborn GCs infected by retroviruses expressed EGFP. The borders between the GC layer (GCL) and hilus or between the GCL and the IML are marked by dashed lines. Scale bar, 50 μm. B, Schema for excitatory and feedforward inhibitory synapses innervating a newborn GC. Stimulating electrode was located in IML (blue double lines). GPSCs or EPSCs were recorded from EGFP-positive newborn GCs in GCL using whole-cell patch-clamp techniques. Stim, Stimulation electrode; Rec, recording pipette; IN, interneuron. C, Representative GPSCs recorded in newborn GCs. Note that feedforward GPSCs were blocked not only by bicuculline (20 μm, C1) but also by CNQX (20 μm, C2). Scale bar, 200 pA and 200 ms. D, Representative EPSCs recorded at the holding potentials of −60 mV (D1) and at +40 mV (D2) in newborn GCs. Scale bar, 500 pA and 200 ms. D1, AMPA-EPSCs were abolished by CNQX (20 μm). D2, When APV (50 μm) was bath-applied to the slice, NMDA-EPSCs were and the outward AMPA-EPSCs were unaffected. The amplitude of NMDA-EPSCs was measured 50 ms after the stimulation (red dashed line and arrow in the inset). Insets, Traces in an expanded time scale. Scale bars, 500 pA and 50 ms. E, Averaged input–output curves of GPSCs (top), AMPA-EPSCs (middle), and NMDA-EPSCs (bottom) from newborn GCs. The amplitudes of evoked GABAergic or glutamatergic PSCs were plotted as a function of stimulus intensity at different dpi's. F, Developmental changes in amplitudes of GPSCs, AMPA-EPSCs, and NMDA-EPSCs recorded in newborn GCs grown in organotypic slice cultures under control conditions. All PSCs were evoked by stimulation of IML at 10 V. The age of GCs are shown as dpi, which represents the number of days elapsed from the day when the slice was infected by EGFP-encoding retrovirus. The number on each symbol indicates number of cells studied (n).

