Figure 3.

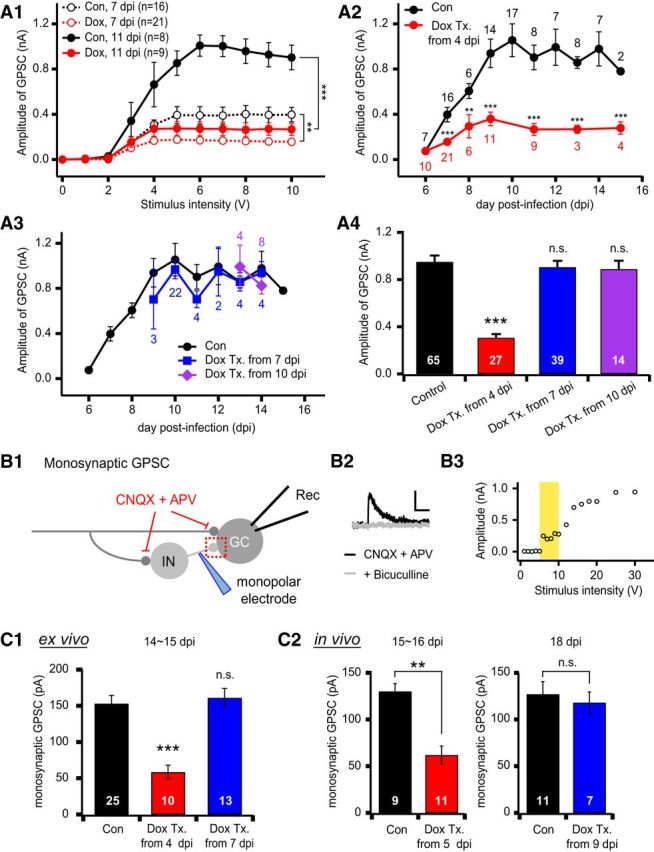
NRG2 is essential for GABAergic synapse formation in newborn GCs. A1, Averaged input–output curves of GPSCs in control (black) and NRG2-depleted (red, Dox-treated from 4 dpi) newborn GCs at 7 dpi (open circles, dotted line) or at 11 dpi (solid circles, solid line). For both GPSCs at 7 and 11 dpi, amplitudes were significantly lower in Dox-treated GCs (control vs Dox; 7 dpi, F(1,35) = 12.03, p = 0.001; 11 dpi, F(1,15) = 24.04, p < 0.001 by RM one-way ANOVA). A2, Effects of NRG2 knock-down on the developmental changes of feedforward GPSCs in newborn GCs. To deplete NRG2 hippocampal slices were treated (Tx.) with Dox from 4 dpi. GPSCs in Dox-treated GCs were significantly lower than control cells as early as 7 dpi. A3, Effects of NRG2 knock-down on GPSCs after the critical period of GABAergic synapse formation (6–9 dpi). The slice cultures were treated with Dox from 7 dpi (blue) or 10 dpi (purple). GPSCs of the treated slice were not significantly different from the untreated control slices at all ages (p > 0.1). In A2 and A3, mean amplitudes of GPSCs evoked by 10 V stimulation of IML were plotted as a function of dpi. A4, Mean amplitudes of GPSCs in newborn GCs older than 9 dpi, at which GPSCs reached a plateau under different Dox treatment conditions. B1, Monosynaptic GPSCs were evoked by minimal stimulation in the presence of AMPA and NMDA receptor antagonists using a monopolar electrode positioned 30–100 μm apart from the soma of a newborn GC. Rec, Recording pipette; IN, interneuron. B2, Representative trace of monosynaptic GPSCs, which was completely blocked by 20 μm bicuculline, a GABAA receptor blocker. Scale bar, 50 pA and 100 ms. B3, Representative input–output curve for monosynaptic GPSCs in newborn GCs. As the stimulation intensity was gradually increased from 1 V, the synaptic responses were all-or-none at a distinct threshold (6 V) and were kept stable for further increase by 5 V from the threshold. Such stable range of stimulation intensity was adopted as the voltage intensity for minimal stimulation (marked with yellow). C, Mean amplitudes of monosynaptic GPSCs in newborn GCs grown in slice cultures (ex vivo, C1) or acute slices (in vivo, C2). The starting dates for Dox treatment or feeding (Dox Tx.) are indicated in the abscissa. The recording dates are indicated above the bar graphs. Monosynaptic GPSCs were suppressed by early Dox Tx (from 4 or 5 dpi), but not by late Dox Tx (from 7 or 9 dpi), in both ex vivo and in vivo experiments.
