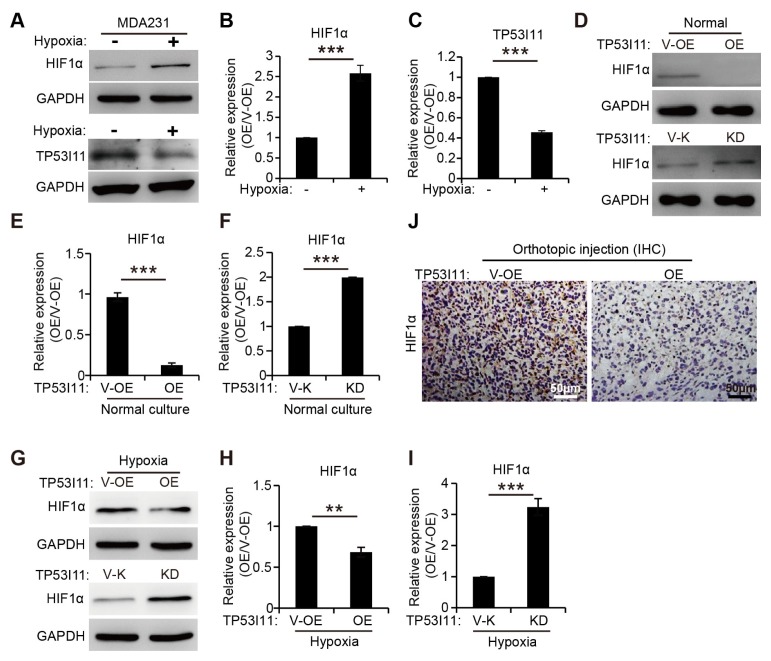
Fig. 4.
TP53I11 reduces the HIF1α protein level. (A) Immunoblotting assays showing decreased protein levels of TP53I11 and increased HIF1α after hypoxic treatment. (B and C) Quantification of the relative protein expression (normalized to GAPDH) in immunoblots. The HIF1α protein levels were also examined in MDA-MB-231-derived cells under normal culture (D), hypoxic treatment (G) and in vivo (J). (E, F, H, and I) Quantification of the relative protein expression (normalized to GAPDH) in immunoblots. V-OE, vector control for overexpression; OE, overexpression; V-K, vector control forknockdown or knockout; KD, knockdown. **P < 0.01, ***P < 0.005. P values were determined using a two-tailed student’s t-test. Error bars represent the S.D.s from the average of at least three biological replicates.

