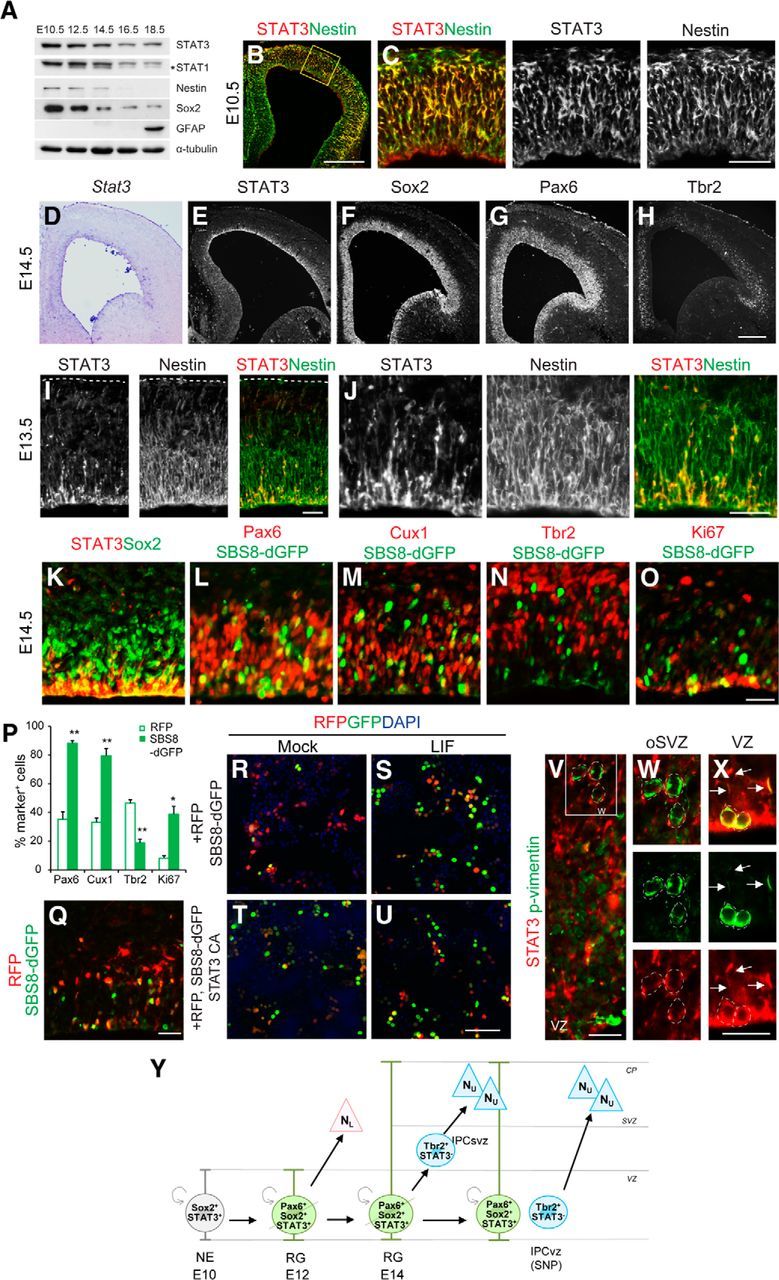
Figure 1.

STAT3 expression in mouse embryonic brains. A, Expression of STAT3, STAT1, nestin, Sox2, GFAP, and α-tubulin in embryonic mouse brains assessed by Western blotting. The asterisk marks a splice variant of STAT1. B, C, STAT3 is expressed in the VZ of E10.5 brains marked by Nestin. D–H, At E14.5, Stat3 transcripts and protein are located in the VZ in which Sox2 and Pax6 are expressed. The IPC marker Tbr2 is more broadly expressed. I, STAT3 expression (red) partially overlaps with that of nestin (green) in E13.5 brains. J, Higher-magnification views of I. K–O, STAT3 protein or STAT3 reporter expression is merged with Sox2, Pax6, Cux1, Tbr2, or Ki67. P, Percentages of STAT3 reporter-labeled cells that express the indicated markers (n = 2–4 embryos, n = 3–5 sections per group). Q, Differential expression of CAG–RFP and STAT3 reporter in the coelectroporated cortex. R–U, The SBS8–H2BdGFP reporter and CAG–RFP were transfected into HEK293T cells. The cells were incubated with LIF for 1 d before harvest. The SBS8–H2BdGFP reporter was activated in response to LIF or when STAT3 CA was cotransfected. V–X, oRG cells and phospho-vimentin + cells (green) in the oSVZ do not express STAT3 (red; W). Mitotic RG labeled by phospho-vimentin on the apical side of the VZ express STAT3 in their nuclei and radial processes (X, arrows). Y, A schematic diagram summarizing the expression of STAT3 and other markers among progenitors. For simplicity, only asymmetrically dividing radial glial cells are shown. NE, Neuroepithelium; SNP, short neural precursor; NL, lower-layer neurons; NU, upper-layer neurons. Error bars represent SEM. *p < 0.05, **p < 0.01, unpaired Student's t test. Scale bars: B, 200 μm; C, and (in H) D–H, Q, 50 μm; I, J, 10 μm; (in O) K–O, V and (in X) W–X, 20 μm; (in U) R–U, 100 μm.
