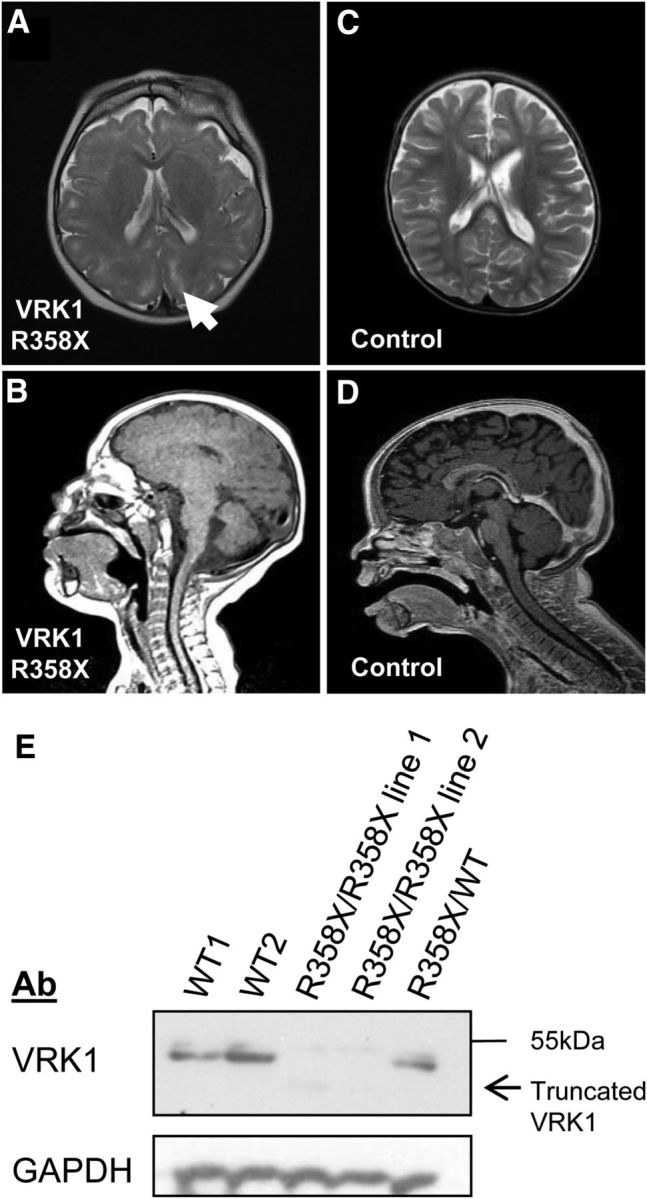
Figure 1.

Brain MRI and VRK1 expression in a VRK1-R358X homozygote. A-D, Brain MRI (age 1 year). A, Axial T2-weighted image shows simplified gyral pattern and enhancement of the perivascular spaces in the subcortical zones (arrow). B, Midsagittal T1-weighted image shows posterior vermis hypoplasia. C–D, Images from an age-matched, healthy child. E, VRK1-R358X is a null mutation. Representative Western blot of endogenous VRK1 and GAPDH in B-cell lysates from two healthy individuals (WT1, WT2), two VRK1-R358X homozygous cell lines, and a VRK1-R358X carrier. In homozygous VRK1-R358X cell lines, mean VRK1 levels are reduced by 18.5-fold (vs WT cell lines) and there is a barely detectable ∼41 kDa band (consistent with truncated mutant VRK1).
