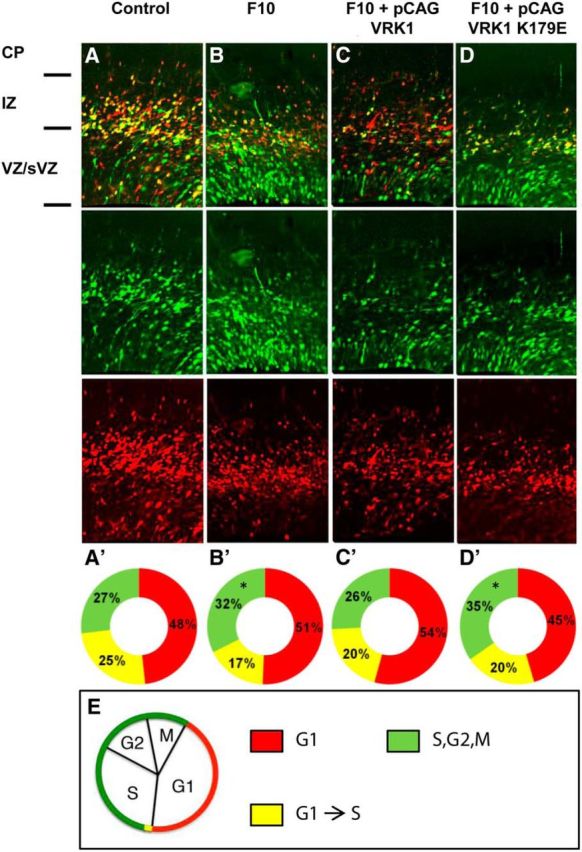
Figure 3.

Vrk1 knockdown affects cell cycle in the developing mouse brain. A–D, Representative mouse brain slices after IUE with FUCCI cell cycle markers and control shRNA (A; N = 4 brains), F10 shRNA (B; N = 3), F10 and CAG-driven WT VRK1 (C; N = 3), F10 and CAG-driven VRK1–K179E (D; N = 3). Top, Merged image of: Middle, green channel, mVenus-hGeminin (S,G2,M)-positive cells and Bottom, red channel, mCherry-hCdt1(G1)-positive cells. A′–D′, The distribution of the proportion of cells expressing each of the FUCCI reporters (counted in separate channels) is represented in circular graphs. Red indicates mCherryCdt1+ (G1) cells. Green indicates mVenus-hGeminin+ (S/G2/M) cells. Yellow indicates that both markers are expressed (G1-to-S transition). Asterisks indicate significant changes compared with control (*p < 0.005). E, Schematic presentation showing the appearance of FUCCI chimeric markers during the cell cycle. CP, cortical plate; IZ, intermediate zone; VZ/sVZ, ventricular and subventricular zones.
