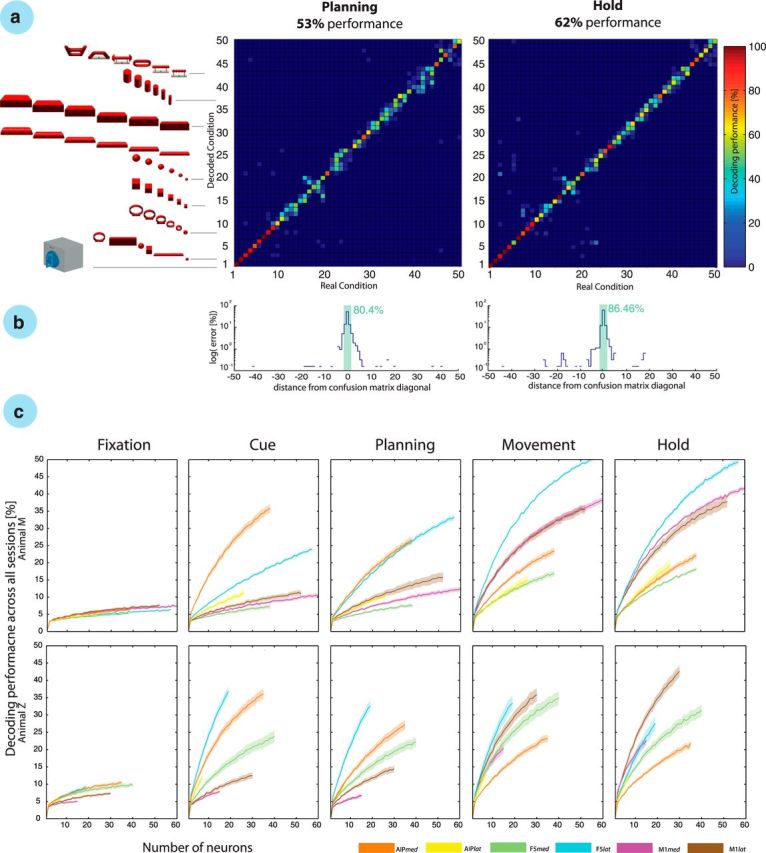
Figure 5.

Object-based decoding. a, The confusion matrix shows the decoding results from the planning and hold epochs of a single recording session. Each decoding condition is illustrated by the 3D object grasped by the monkey. From 1 to 50: 1–2, precision and power grip on handle; 3–8, mixed turntable; 9–14, rings; 15–20, cubes; 21–26, balls; 27–32, horizontal cylinders; 33–38, bars; 39–44, vertical cylinders; and 45–50, abstract forms. b, Error distribution in the confusion matrix as a function of distance to the matrix diagonal; note the logarithmic scale for the planning and motor epochs. Green bar sums the percentage of trials with correct and distance-1 errors. c, Neuron-drop analysis for all task epochs and both animals across all recording sessions. Decoding performance is plotted versus the number of randomly selected neurons for each of the implanted microelectrode arrays for each epoch and animal. Solid lines show the mean decoding performance for specific arrays, whereas shades indicate SEM across 10 sessions in each animal. Lines stop at the minimal number of recorded neurons across all sessions.
