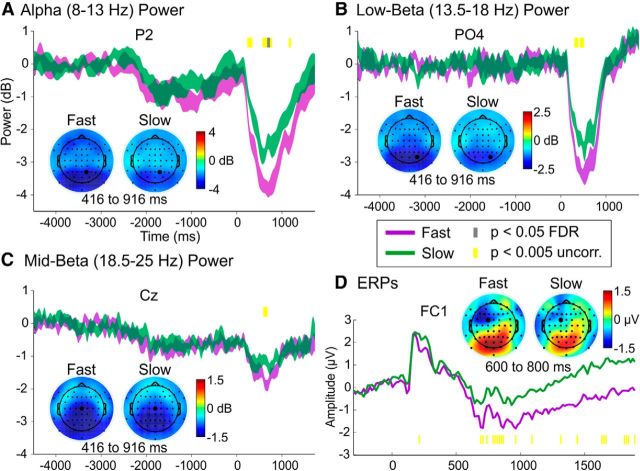
Figure 7.
This figure illustrates that Informative retro-cue trials with Fast RTs (collapsed across cue type) modulated alpha (A), low-beta (B), mid-beta (C), and ERP (D) activity relative to trials with Slow RTs. In each panel, the time course from one channel is displayed; this channel is darkened in the corresponding topographies. The time points that significantly differed between Fast and Slow are marked toward the top of the plots for the oscillations and toward the bottom of the plot for the ERPs. uncorr., Uncorrected.

