Figure 5.
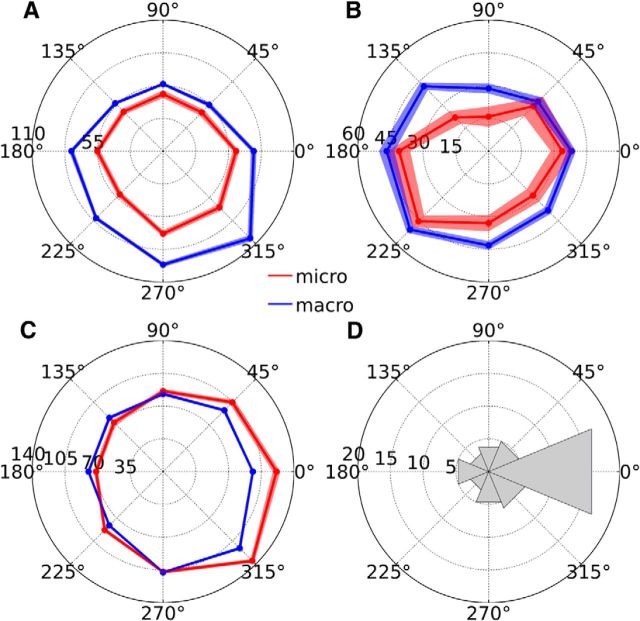
Direction selectivity. A–C, Direction tuning curves of three example PCs, with microsaccade-related activity shown in red and macrosaccade-related activity shown in blue. The angle of the polar plot corresponds to the saccade direction and the radius corresponds to the spike rate. Light transparencies indicate ± 1 SEM. D, Circular histogram of the angular distance between the microsaccade-related and macrosaccade-related direction tuning curves, computed for each PC (n = 48); 0° indicates perfect correspondence between the two tuning curves, 180° indicates opposite selectivity, 45–135° indicate counterclockwise shifts of the microsaccade-related direction tuning curve relative to the macrosaccade-related direction tuning curve, and 225–315° indicate clockwise shifts of the microsaccade-related direction tuning curve relative to the macrosaccade-related direction tuning curve.

