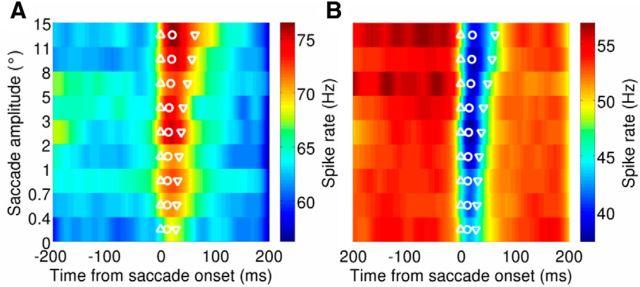
Figure 7.
Population activity for bursting PCs (A; n = 48) and pausing PCs (B; n = 55). Spike density functions are separated according to the saccade amplitude, with microsaccades shown in the bottom three rows. The population average spike rate is shown with the color map. For each amplitude, the mean saccade onset, time of peak speed, and offset are shown with the upward triangle, circle, and downward triangle, respectively.

