
Figure 3.
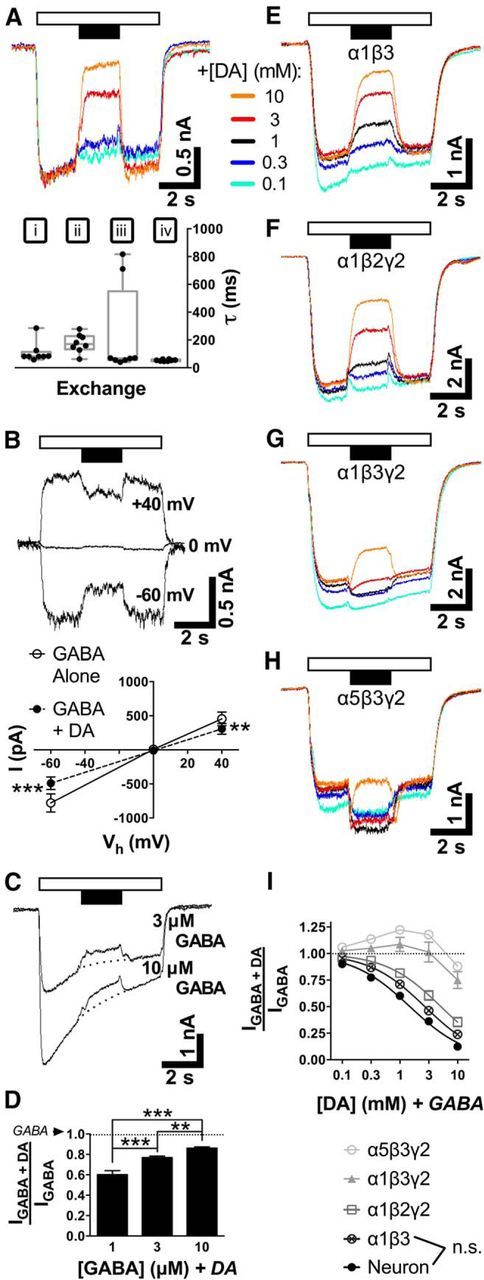
DA rapidly modulates currents evoked by applying tonic levels of GABA. A, Traces demonstrating effects of DA application (filled bar) on GABA (1 μm, unfilled bar) in a typical neuron. Roman numerals represent GABA onset from control solution (i), GABA + DA onset (ii), DA termination (iii), and control resumption (iv). The graph shows response times (τ) following solution exchanges i, ii, iii, or iv for DA (1 mm) and/or GABA (1 μm). Median values are plotted with interquartile range (box) and overall range (whiskers). B, Current–voltage relationship (top, traces; bottom, mean ± SEM) for inhibition of GABA (1 μm) by DA (1 mm). Vh, Holding potential. C, D, Effect of increasing GABA concentrations on DA (1 mm) inhibition (C), quantified in D (mean ± SEM). E–H, Traces showing GABAAR subtype-dependent effects of DA on GABA (1 μm) for recombinant receptors expressed in HEK293 cells. I, Concentration–response curves (mean ± SEM) comparing amplitudes from DA-evoked modulation of GABA (1 μm) in untransfected neurons and transfected cells expressing recombinant receptor subtypes. Differences between α1β3 and neuron values were not significant (n.s.) at any individual concentration (see Results). **p < 0.01; ***p < 0.001.