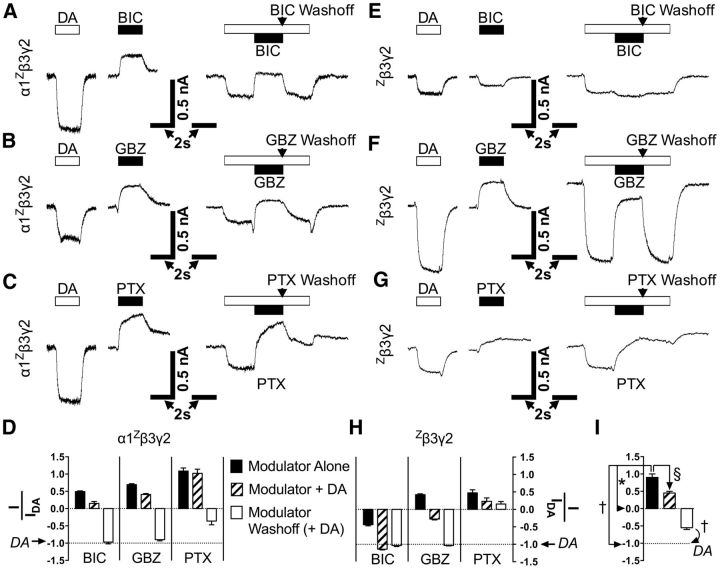
Figure 7.
Effects of GABAA antagonists on DA-gated GABAARs. A–C, For α1Zβ3γ2, traces show typical effects of DA (1 mm, unfilled bars) or antagonist (10 μm, filled bars) applied alone (left) or in the middle of a DA pulse (1 mm, right). D, Comparative analysis (mean ± SEM) of antagonists acting on α1Zβ3γ2 alone or in combination with DA. All comparisons are made to 1 mm DA-evoked amplitudes in individual cells (normalized to −1, dotted line). Concentrations are the same as A–C. Washoff represents removal of antagonist only. E–G, Same as A–C, but for Zβ3γ2 receptors instead of α1Zβ3γ2. H, Analysis as done in D, except with Zβ3γ2. I, Example of statistical comparisons and symbols used in Table 1 for a single ANOVA of a hypothetical drug. All comparisons for Figure 7 are shown in Table 1.

