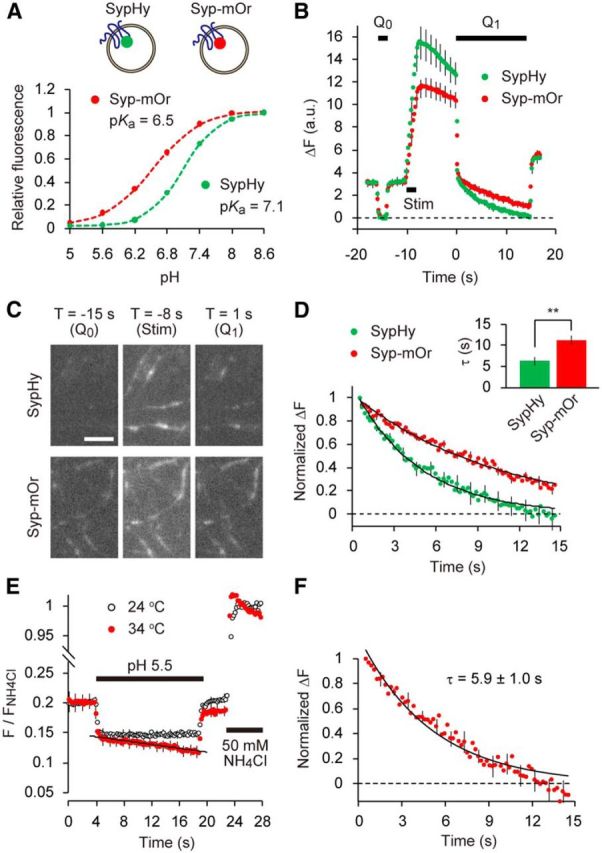
Figure 1.

SV re-acidification monitored by mOrange2. A, Titrations of sypHy (green) and syp–mOr (red) expressed in cultured hippocampal neurons. pHluorin and mOrange2 were positioned at the luminal part of synaptophysin. Fluorescence intensities at each pH were normalized to those at pH 8.6 and were expressed as a function of pH. Both data were well fitted by a single-site titration model (see Materials and Methods). The pKa and nH were determined as 6.54 ± 0.05 and 0.99 ± 0.02 for syp–mOr and 7.09 ± 0.02 and 1.35 ± 0.02 for sypHy (n = 6 experiments with 38 boutons for sypHy and n = 5 experiments with 64 boutons for syp–mOr). B, Comparison of fluorescence between sypHy and syp–mOr during the acid-quench experiment. Acidic solution (pH 5.5) was applied before (Q0) and after (Q1) field electrical stimulation (50 Hz, 2 s). The decay in fluorescence during poststimulus acid quench (Q1) represented re-acidification of the endocytosed SVs retrieved within an 8 s interval (n = 14 experiments with 280 boutons for sypHy and n = 14 experiments with 214 boutons for syp–mOr). C, Fluorescence images of presynaptic boutons expressing sypHy (top) and syp–mOr (bottom), during Q0, 50 Hz stimulus and at the onset of Q1. T indicates a time point on the horizontal axis of the plot shown in B. Scale bar, 5 μm. D, The fluorescence from sypHy and syp–mOr during poststimulus acid quench (Q1) shown in B was normalized to the fluorescence during Q0. Inset, The time constant obtained from a single-exponential fit to the syp–mOr fluorescence was significantly larger than that to sypHy fluorescence (**p < 0.01, Student's t test). E, Temperature-dependent effect of acid exposure on syp–mOr fluorescence. Fluorescence was monitored at either 24°C (room temperature; black open circles) or 34°C (physiological temperature; red filled circles) and normalized to the fluorescence obtained by 50 mm NH4Cl application (n = 7 experiments with 104 boutons for 24°C and n = 7 experiments with 140 boutons for 34°C). The fluorescence apparently declined at 34°C, which was linearly fitted with a slope of −0.0016 ± 0.0004 s−1. This artificial decline of baseline fluorescence also potentially contributed to the fluorescence decay during poststimulus acid quench when measured at 34°C. F, Normalized fluorescence decay during re-acidification measured at 34°C (n = 10 experiments with 154 boutons). To obtain this, acid-quench experiments were performed similar to B and combined with 50 mm NH4Cl application. F/FNH4Cl during acid treatment was corrected by subtracting the re-acidification-independent decline seen in E. Dashed line indicates the fluorescence during Q0. Error bars indicate SEM.
