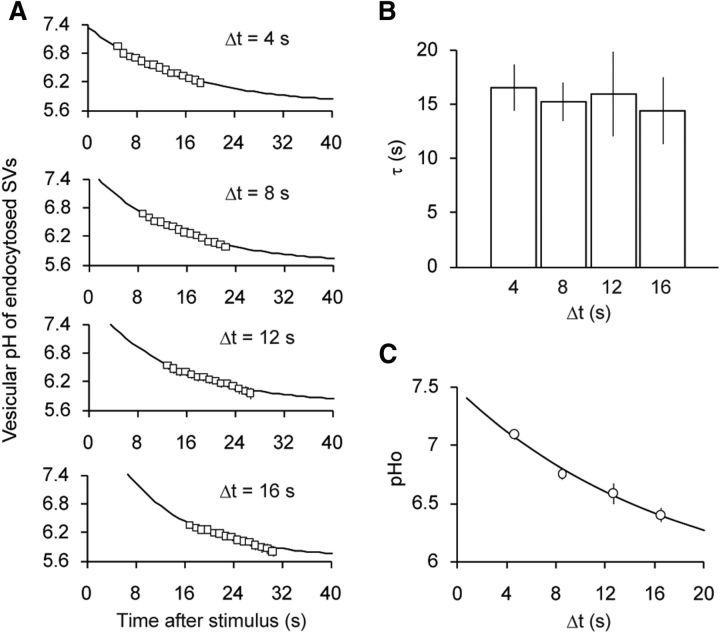
Figure 4.
Re-acidification kinetics of different SV populations. A, Luminal pH of SVs endocytosed during varying stimulus-to-quench intervals (Δt). After stimulus, a 15 s acid quench was applied after Δt of 4 s (n = 9 experiments with 112 boutons), 8 s (n = 9 experiments with 129 boutons), 12 s (n = 10 experiments with 145 boutons), and 16 s (n = 10 experiments with 131 boutons). pHs of the endocytosed vesicle fraction were calculated as described in Figure 2. B, Comparison of the re-acidification kinetics measured with different Δt. The time constants were ∼15 s regardless of Δt (p = 0.96, ANOVA). C, pHvs of endocytosed fraction at the onset of poststimulus acid quench (pHo) plotted against Δt. A single-exponential fitting yielded a time constant of 17.8 s. Error bars indicate SEM.

