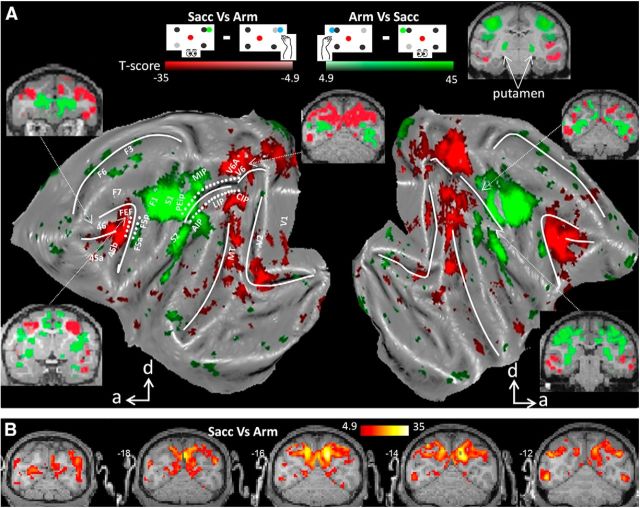
Figure 2.
Effector preference. A, Flattened cortex showing t-score maps representing preference for operant behavior. Conjunction analysis was performed between the two monkeys (p < 0.05, FWE corrected). t-values for the contrast saccade versus arm movement are shown in red; t-values for arm movement versus saccade are shown in green. d, Dorsal; a, anterior. White dots along IPS and AS indicate the path used for analysis in Figure 3. B, Coronal sections centered over posterior parietal cortex showing the results of conjunction analysis across two monkeys (p < 0.05, FWE corrected, t-values for the contrast saccade vs arm movement).

