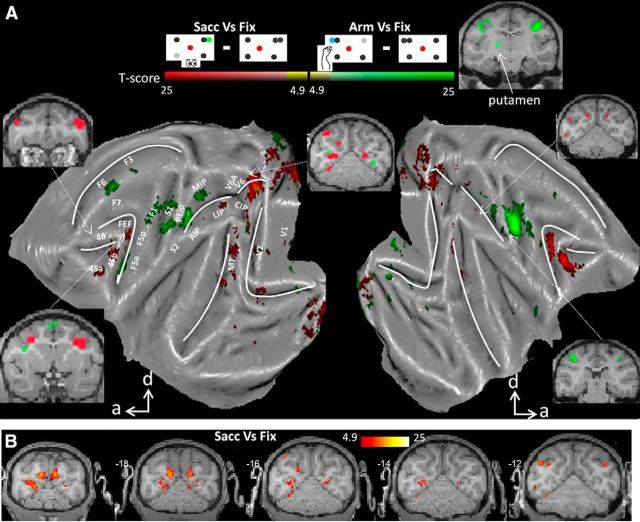
Figure 4.
Effector specificity. A, Flattened cortex showing t-score maps representing effector specificity. A conjunction analysis was performed between the two monkeys (p < 0.05, FWE corrected). t-values for the contrast saccade versus fixation are shown in red; t-values for arm movements versus fixation are shown in green. Overlap is shown in yellow. B, Coronal sections centered over posterior parietal cortex with contrast saccade versus fixation (t-score maps, p < 0.05, FWE corrected).

