Figure 8.
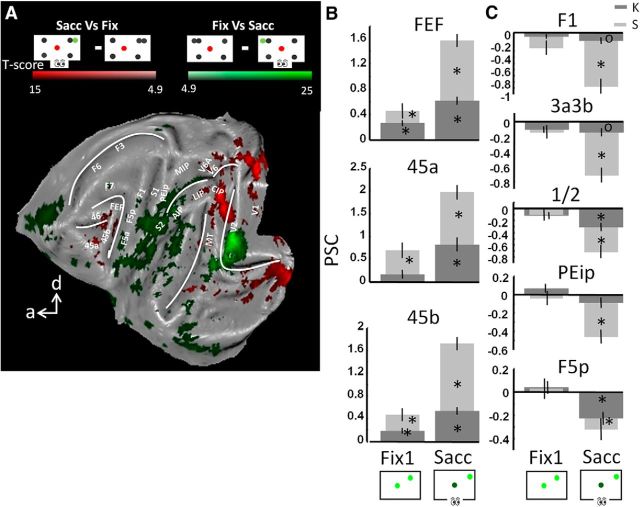
Control Experiment 2. A, Flattened cortex showing t-score maps for a conjunction analysis between two monkeys (Monkeys K and S, p < 0.05, FWE corrected). The contrasts saccade versus fixation (red) and fixation versus saccade (green) are shown. B, C, Percent signal change per condition for Monkeys K and S during Sacc. Baseline is PSC during fixation without distractors. *p < 0.05, corrected for multiple comparisons; op < 0.01, uncorrected (compared with baseline). Black bars represent the SEM across runs. B, Sacc network. C, Arm network.

