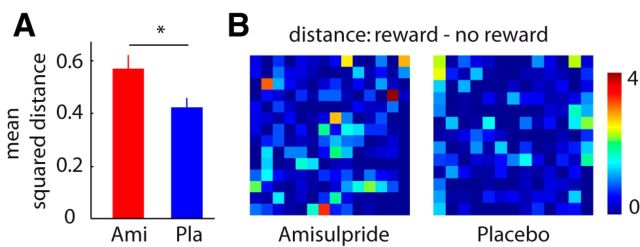
Figure 3.
Amisulpride enhances pattern separation in the OFC. A, Bar plots depict average squared difference between activity patterns related to reward and no reward. Asterisk depicts significant two-sample t test at p < 0.05 (one-tailed). Error bars depict SEM. B, Squared difference between activity patterns related to reward and no reward for a representative subject in the amisulpride group (Ami; left) and in the placebo group (Pla; right). Each pixel represents the squared difference (reward minus no reward) in the activity of one voxel in the medial OFC. The color map represents squared activity difference and is min − max scaled across both displayed patterns. The two subjects were selected such that their average squared pattern difference is close to the mean of their respective group (amisulpride subject = 0.55 [amisulpride group average = 0.57], placebo subject = 0.43 [placebo group average = 0.42]).

