Figure 6.
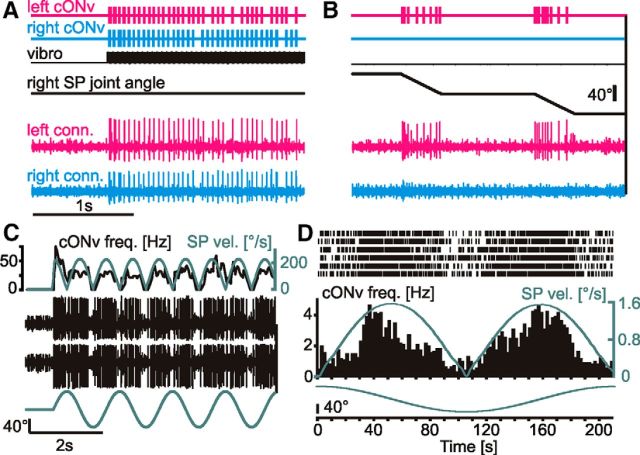
cONv exclusively receives contralateral antennal input and is sensitive to sinusoidal movement of the SP joint, even at very slow velocities. A, B, Bottom, Simultaneous recordings of the left (magenta) and right (cyan) neck-connectives. cONv was the largest unit in both recordings. Top two traces represent the timing of cONv spikes, extracted by thresholding the extracellular recordings of the neck connectives. Middle two traces represent the tapping stimulus (vibro) and the right SP joint angle. The left and right cONv responded to the tapping stimulus (A), but only the left cONv responded to stimulation of the right SP joint (B). C, cONv response to sinusoidal movement of the SP joint at 0.69 Hz (bottom), with simultaneous neck-connective recordings at two different positions on the same side (middle black traces). cONv was the largest unit in both recordings. The spike frequency of cONv (top black line) followed the time course of the SP joint angle velocity (top gray line). D, Same type of experiment as in C, but with very low stimulus velocity. cONv spiked reliably (raster plot with PSTH below) during 6 consecutive cycles of sinusoidal SP joint movement at 0.0047 Hz. Bottom gray trace represents SP joint angle. Middle gray trace represents stimulus velocity. The spike frequency of cONv follows the time course of SP joint angle velocity at velocities exceeding 0.4°/s. C, D, Velocity traces were averaged, using a 50 ms time window. C, The mean spike frequency was averaged, using a 100 ms time window.

