
Figure 2.
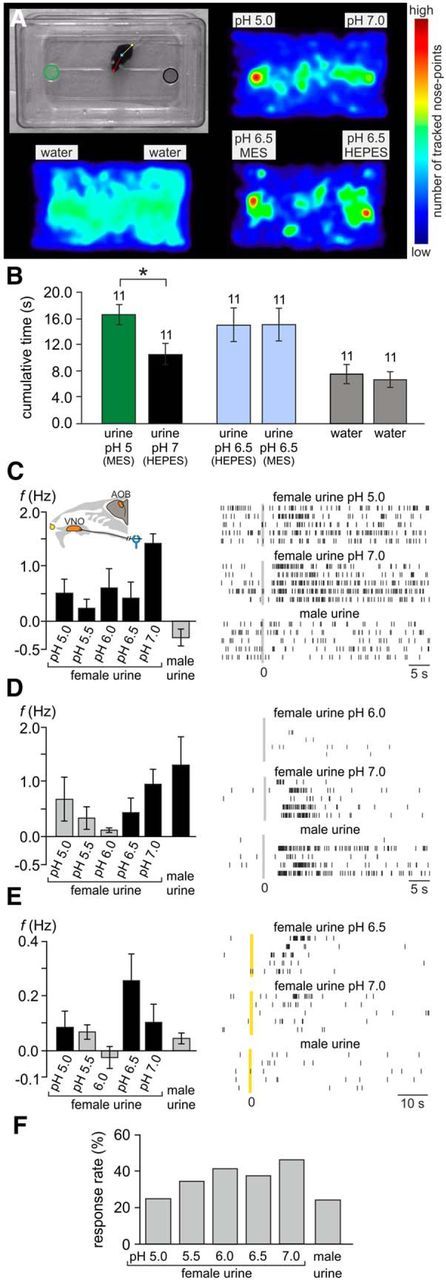
Urinary pH constitutes a chemosensory signaling parameter. A, B, Two-choice assay reveals male place preference for acidic female urine. A, Experimental setup (top left) and accumulated heat maps depicting the count of tracked nose points (normalized to the overall maximum value). Top left, Single video frame illustrating assay design. Dishes used for stimulus presentation on either side of the cage are marked as areas of interest (green and black circles). Markers on the mouse denote multiple software-defined body points (nose, center, tail base) used for automated (and manually verified/corrected) tracking. Other images show pseudocolor heat maps of normalized nose-point distribution under three different experimental conditions: urine/pH 5 (MES-buffered) versus urine/pH 7 (HEPES-buffered) (top right), water versus water (bottom left), and urine/pH 6.5 (MES-buffered) versus urine/pH 6.5 (HEPES-buffered) (bottom right). B, Behavioral assay quantification. The bar graph shows the average cumulative duration (mean ± SEM) that an animal's nose point was detected within each area of interest. The asterisk denotes statistical significance; p < 0.001 (paired-sample t test). C–E, Stimulus-induced firing rate changes of three individual representative AOB units. Left, Bar charts depicting average changes in spike frequency (mean ± SEM; across all repeated presentations of the same stimulus) in response to female urine at five different pH values (5.0–7.0) and male urine, respectively. Black bars indicate firing rate changes that are statistically significant (see Materials and Methods). Gray bars correspond to rate variations that were not statistically significant from prestimulation baseline activity. The inset in C shows a schematic of the experimental in vivo preparation. Right, Raster displays of unit activity in response to three of the six stimuli. For each unit, discharge in response to male urine, neutral female urine (pH 7.0), and either of four acidic female urine stimuli is shown. Within each panel, each row indicates spike times during a single stimulus presentation. Per panel, all five rows display responses to the same stimulus. Time 0 indicates sympathetic nerve stimulation (C, D) or stimulus application to the nostril (E). F, Percentage of significant stimulation-induced responses (p < 0.05; Kruskal–Wallis one-way ANOVA) for female urine at different pHs and for male urine. Units included in this analysis were those responding to at least one of the female stimuli (n = 133).