Figure 4.
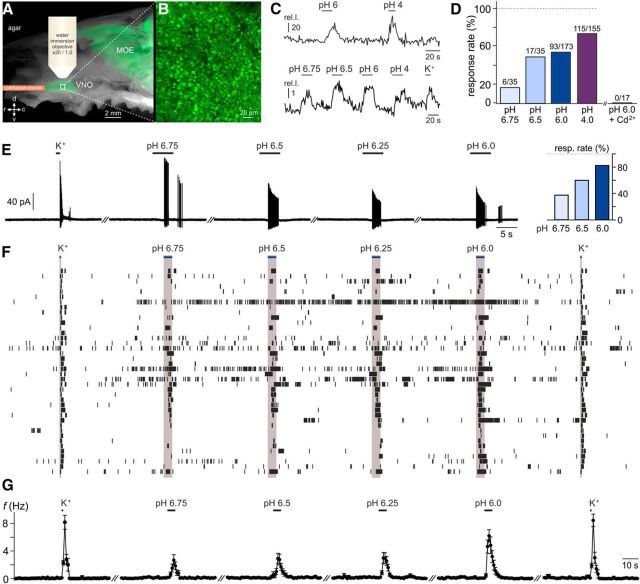
Subtle changes in extracellular pH induce vomeronasal responses under physiological conditions. A–D, Luminal acidification is sufficient to stimulate VSNs. A, Merged macroscopic bright-field and fluorescence image of the hemisected rostral head of an OMP-GFP mouse illustrating the en face confocal Ca2+-imaging approach. The schematic depicts the position of the perfusion pencil and microscope objective. The white box delimits a region of the sensory epithelium shown at a higher magnification in B. MOE, Main olfactory epithelium. B, Three-dimensional reconstruction of a confocal z-stack scan of the VNO dendritic knob surface (epithelial area shown in A). Note that individual knobs are readily discernible. C, Top, Representative original recording of cytosolic Ca2+ signals in a VSN dendritic knob in response to acidic solutions (pH 6, pH 4). Bottom, Average trace from 17 individual knobs stimulated with decreasing pH values (6.75, 6.5, 6.0, and 4.0) and elevated extracellular potassium (K+; 100 mm). The integrated relative fluorescence intensities in user-defined regions of interest are displayed in arbitrary units and viewed as a function of time. D, Bar graph showing the percentage of proton-sensitive VSNs. Data are normalized to the proportion of neurons responding to K+-mediated membrane depolarization. While threshold Ca2+ signals are observed upon relatively mild acidification (pH 6.75), the percentage of pH-sensitive neurons increases dose dependently. Numbers of individual VSN knobs are indicated above bars (n = 35–173; 14 animals). Note that dendritic Ca2+ elevations in response to both the acidic solution (pH 6) and K+-dependent depolarization are abolished after Cd2+ incubation (200 μm; 4 min; n = 17; 5 animals). E–G, pH-dependent AP discharge recorded in a loose-seal cell-attached configuration, a recording mode that keeps the intracellular milieu intact and does not perturb VSN input resistance and resting potential. E, Original representative recordings from a single neuron challenged successively with elevated K+ (50 mm) and increasing extracellular proton concentrations (pH 6.75–pH 6.0). Horizontal black bars indicate stimulation (K+, 1 s; pH, 5 s). Inset (right), Bar chart depicting response rate versus proton concentration. Data are normalized to the K+-sensitive VSN population. F, Spike raster plot of 40 VSNs stimulated as in E. Stimulus exposure is indicated by the horizontal blue bars and gray columnar shading. G, Peristimulus time histogram (PSTH) illustrating K+-/pH-dependent changes in spike frequency over time. Individual data points in a given PSTH depict the average firing rates of all tested VSNs (means ± SEM; 1 s bin width; n = 40). Stimulus-evoked mean firing rates up to 6.2 ± 0.9 Hz were recorded (pH 6.0).

