
Figure 5.
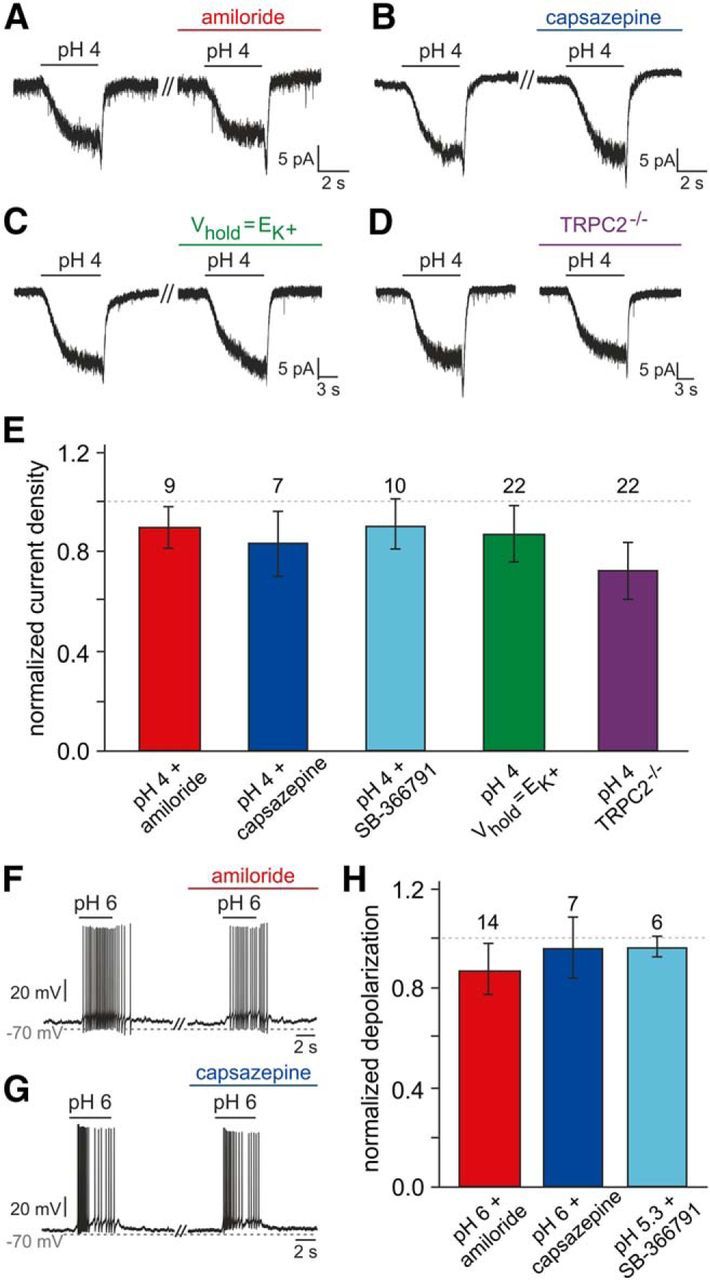
Addressing the mechanistic basis of vomeronasal proton sensitivity. A, B, Representative original recordings of acid-induced currents (pH 4; Vhold = −70 mV) under control conditions and during pharmacological treatment (preincubation, ≥120 s). No obvious changes are detected in presence of either amiloride (100 μm; A) or capsazepine (10 μm; B). C, Representative acid-evoked currents (pH 4; Vhold = −70 mV) under control conditions (EK+ = −86 mV) and at a set K+ equilibrium potential (EK+ = Vhold). Eliminating the driving force on K+ does not alter pH sensitivity. D, Original recordings of acid-induced responses in VSNs from both wild-type animals (left) and mice with homozygous deletions of the trpc2 gene (TRPC2−/−; right). E, Bar graph (mean ± SEM) quantitatively summarizing the experimental results exemplified in A–D [additionally including data obtained using the TRPV1 inhibitor SB-366791 (10 μm; 90 ± 10%)]. Neither experimental condition nor animal genotype causes significant differences in response current density (one-way ANOVA). Data are normalized to results obtained from the same neurons before pharmacological treatment (amiloride, 90 ± 8%; capsazepine, 83 ± 13%) or a different sample of neurons comparable in size (Vhold = EK+, n = 17, 87 ± 12%; TRPC2−/−, n = 23, 72 ± 11%). The number of cells tested under each condition is indicated above individual bars. The dashed line denotes 100%. F–H, Acidification-dependent membrane depolarization and AP discharge under control conditions and during pharmacological treatment. F, G, Representative original recordings of acid-induced depolarizations and superimposed spikes (pH 6; drug preincubation, ≥120 s) in the absence and presence of either amiloride (100 μm; F) or capsazepine (10 μm; G). H, Bar chart (mean ± SEM) describing the quantitative analysis of experiments exemplified in F and G (including additional data obtained using SB-366791, 10 μm).