Figure 2.
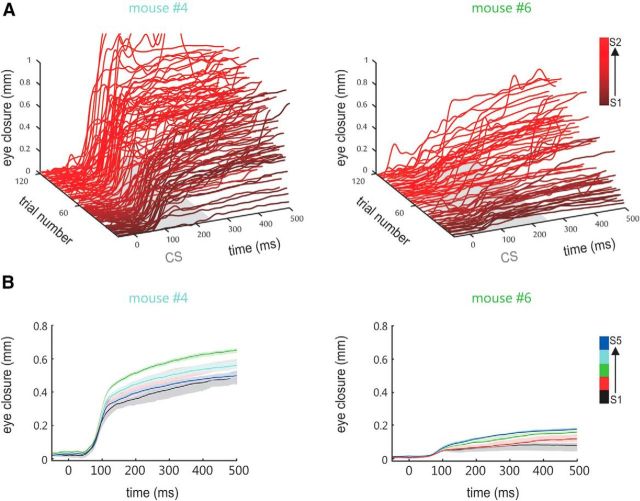
Conditioned responses. A, Eye closure traces recorded in two animals (font colors fit the lines in Fig. 3A) during the acquisition of the TTEBC task. The CRs that occurred during the first 120 trials (sessions S1 and S2) are shown (traces run from 20 ms before CS to the end of the trace period; for purposes of illustration, the earlier trials are colored darker than the later ones). Note that animals received five CS and US presentations before the start of the session to adjust the position of the optic sensor and the air puff outlet (see Materials and Methods). B, Mean eye closure (±SEM) plotted across trial time as observed in each of the five training sessions (S1–S5, colored black to blue) for the animals shown in A.

