Figure 3.

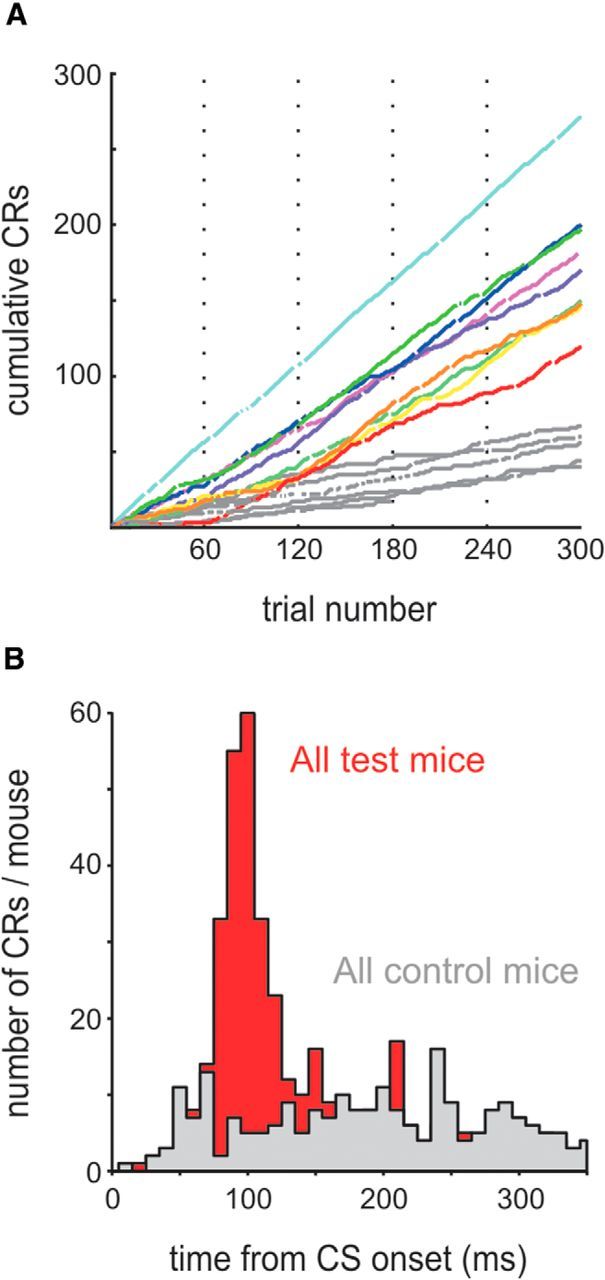
Behavioral performance. A, Cumulative CR count across all training sessions (S1–S5) plotted across trials (gaps in the curves indicate invalid trials because of blinking in the interval 500 ms before CS onset; vertical dotted lines separate training sessions). Each colored line plots the cumulative learning curve of one test animal. Data from control animals are plotted in gray. B, Histogram of CR latencies observed in nine test mice (red) and six control mice (gray).
