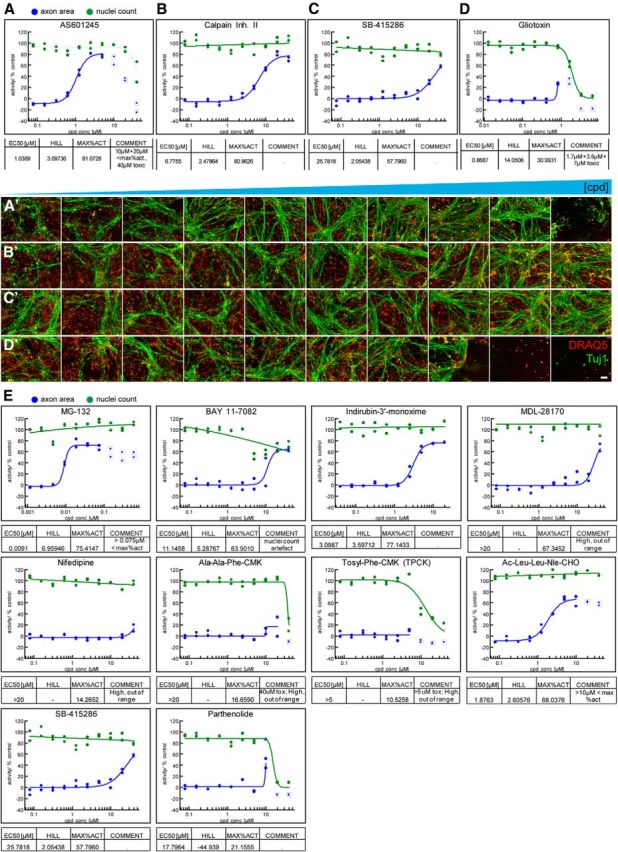
Figure 2.

Assay validation with known neuroprotective compounds. A–D, Concentration–response curves for validation compounds. Representative curves for JNK inhibitor AS601245, calpain inhibitor-II, GSK3 inhibitor SB-415286, and the mycotoxin Gliotoxin are shown (N = 2 independent experiment with n = 2 each). Nuclei count and axon area data are expressed as percentage inhibition and percentage protection relative to controls. Maximal activation (MAX%ACT) represents the percentage of axonal protection achieved relative to NGF-positive controls. AS601245 demonstrates potent neuroprotection at ∼1 μm and toxic side effects at >5 μm. Calpain Inhibitor II displays a clean neuroprotection profile with a 7 μm EC50 and 80% maximal activation. SB-415286 displays modest neuroprotection with an EC50 of ∼25 μm. Gliotoxin is not protective and displays toxicity at >1 μm. Data points surrounded by squares were masked when generating curves. A′–D′, Single-imaging fields from the assay plate corresponding to the concentration–response curves shown in A–D compound (cpd; concentrations ascending from left to right). DRAQ5 is shown in red while Tuj1 is shown in green (N = 2). Scale bar, 100 μm. E, Protective effects of compounds previously identified in an axon lesion paradigm. MG-132, BAY 11–7082, Indirubin 3′-monoxime, MDL-28170, Ac-Leu-Leu-Nle-CHO, SB-415286, and parthenolide protected axons from degeneration while nifedipine, Ala-Ala-Phe-CMK, and Tosyl-Phe-CMK did not.
