Figure 3.
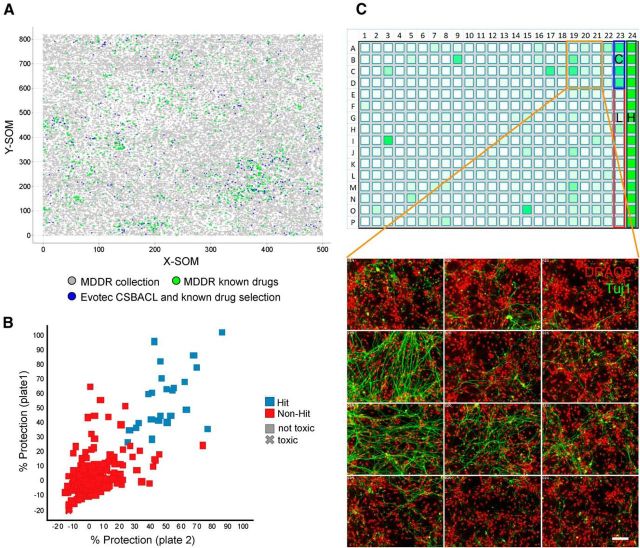
Overview of small molecule screen for regulators of axon degeneration. A, Compounds selected for the screen. Emergent self-organizing maps (SOM) obtained for the MDDR collection and the Evotec known drugs and bioactives. Each dot corresponds to a compound. X-SOM and Y-SOM correspond to the X and Y direction of the calculated self-organizing map. The distance between dots is an expression of structural similarity between compounds. Green dots represent molecules from the MDDR classified launched drugs while gray dots represent the remainder from the MDDR collection (221,055 compounds total). Blue dots represent the 871 compounds screened that consist of known drugs as well as additional compounds with known bioactivity (CSB ACL collection). B, Scatter plot showing results from primary DRG screen. Compound plates were screened at 20 μm in duplicate and a correlation of the respective percentage neuroprotection values is shown. The R2 value of the replicate data points was 0.57. The mean Z′ value of the screening plates was 0.61. Hits (blue squares) versus nonhits (red squares) were qualified based on the hit threshold of 25% protection. Compounds reducing nuclei number <70% of NGF control were defined as cytotoxic (X shaped) and excluded from the hit set. Forty-two compounds fulfilled these hit criteria. C, Example of results from primary DRG screen. A screening plate is shown as a heat map indicating axonal protection in shades of green color (top). High (positive) controls (H; 100%) are NGF wells located in column 24, and low (negative) controls (L; 0%) are anti-NGF wells located in column 23. A neuroprotective compound served as a quality control (C). Representative primary data from the screen with Tuj1 in green and DRAQ5 in red. Some wells have a degree of Tuj1 staining indicating protection of axons while others do not. Scale bar, 50 μm.

